
 Facebook
 X
X
 Pinterest
 Copy Link
Home Buying • Market Stats • Real Estate News • Real Estate Tips • seattle • Windermere Bellevue Commons News • Windermere Bellevue Commons News | Tagged homeless •
July 24, 2023
Seattle & Bellevue Real Estate Market Update: February 2023

Seattle & Bellevue Real Estate Market Update: February 2023
In February 2023, Seattle and Bellevue, WA continue to be strong housing markets. With a population of 3.9 million, the Seattle-Tacoma metropolitan area is the 15th largest in the United States. The area continues to benefit from its diverse economy, which is driven by technology, manufacturing, and health care. The Seattle-Bellevue housing market remains competitive. Home prices have increased by 2% percent in the past year, with an average listing price of $803,750.
Market Stats • Real Estate News • windermere • Windermere Bellevue Commons News • Windermere Bellevue Commons News | Tagged homeless •
September 4, 2019
The Slow Down in Foreign Buyers
Originally published on the Windermere Blog.
Home Buying • Market Stats • Real Estate News • seattle • windermere •
August 8, 2018
What’s Happening in the Market in June 2018?
The local real estate market looks like it might finally be showing signs of softening, with inventory up and sales down. More sellers have opted to put their homes on the market. Inventory was up 47 percent in King County and price increases were in the single digits. Despite the increase in inventory and slowdown in sales, it’s still a solid seller’s market. Over half the properties purchased in June sold for more than list price.
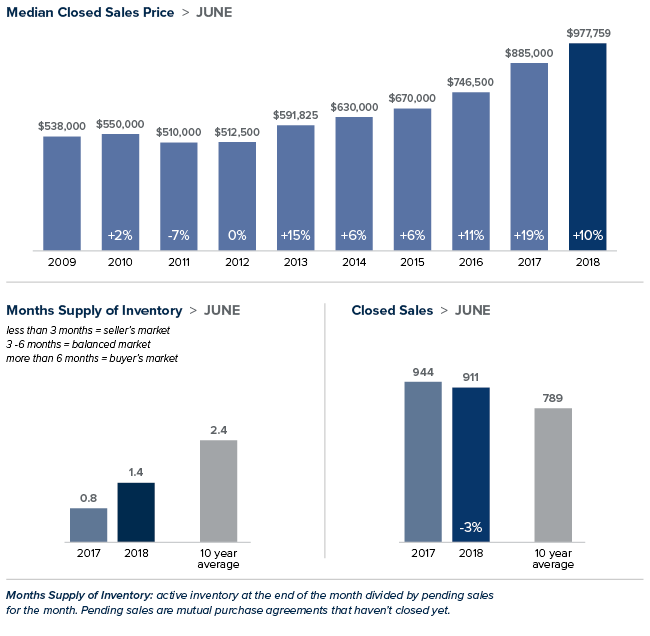
Eastside

>>>Click image to view full report.
A booming economy offered little price relief for buyers looking on the Eastside. In a recent study of economic strength by state, Washington ranked number one in the country. An additional report targeting cities ranks the Seattle-Bellevue-Tacoma market as the nation’s fourth strongest economy. The median price of a single-family home on the Eastside rose 10 percent over a year ago to $977,759 setting another record. There is some good news for buyers. Inventory rose to its highest level in three years, with the number of homes for sale increasing 46 percent from the same time last year.
King County
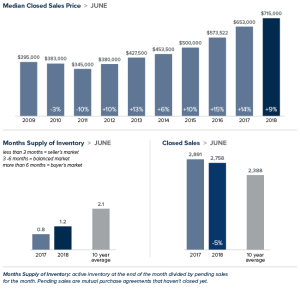
>>>Click image to view full report.
The number of homes on the market in King County soared 47 percent from a year ago, the biggest increase since the housing bubble burst. Despite the increase, there is just over one month of available inventory, far short of the four to six months that is considered a balanced market. The median price of a single-family home increased 9 percent over last June to $715,000. That’s down 2 percent from the $726,275 median in May. Home prices haven’t dropped from May to June in King County since the last recession.
Seattle

>>>Click image to view full report.
Seattle trails only Bay Area cities when it comes to greatest profits for home sellers. That may help explain the surge in inventory in June. For example, the number of homes for sale in the popular Ballard/Green Lake area doubled from a year ago. Even though buyers are finally getting more choices, demand still exceeds supply. Homes sell faster in Seattle than in any other U.S. real estate market. That demand propelled the median price of a single-family home to $812,500; up 8 percent over last June and down from the record $830,000 set in May.
Snohomish County

>>>Click image to view full report.
The largest jump in home prices in the region came in Snohomish County. While higher-priced markets in King County are seeing increases slowing slightly, the median price of a single-family home here jumped 14 percent to $511,500, a new high for the county. Buyers willing to “keep driving until they can afford it” are finding Snohomish County an appealing destination.
This post originally appeared on windermere-bellevue.com
Market Stats • Real Estate News • seattle • windermere • Windermere Bellevue Commons News | Tagged homeless •
July 18, 2018
Eastside Statistics Slideshow Template – July 2018
Home Buying •
May 9, 2018
How Rising Prices Will Help You Build Family Wealth In 2018

Homeowners can build wealth by purchasing a home. Over the next five years, home prices are expected to appreciate on average by 3.35% per year and to grow by 24.34% cumulatively, according to Pulsenomics’ most recent Home Price Expectation Survey.
So, what does this mean for homeowners and their equity position?
As an example, let’s assume a young couple purchases and closes on a $250,000 home this month (January). If we only look at the projected increase in the price of that home, how much equity will they earn over the next 5 years?
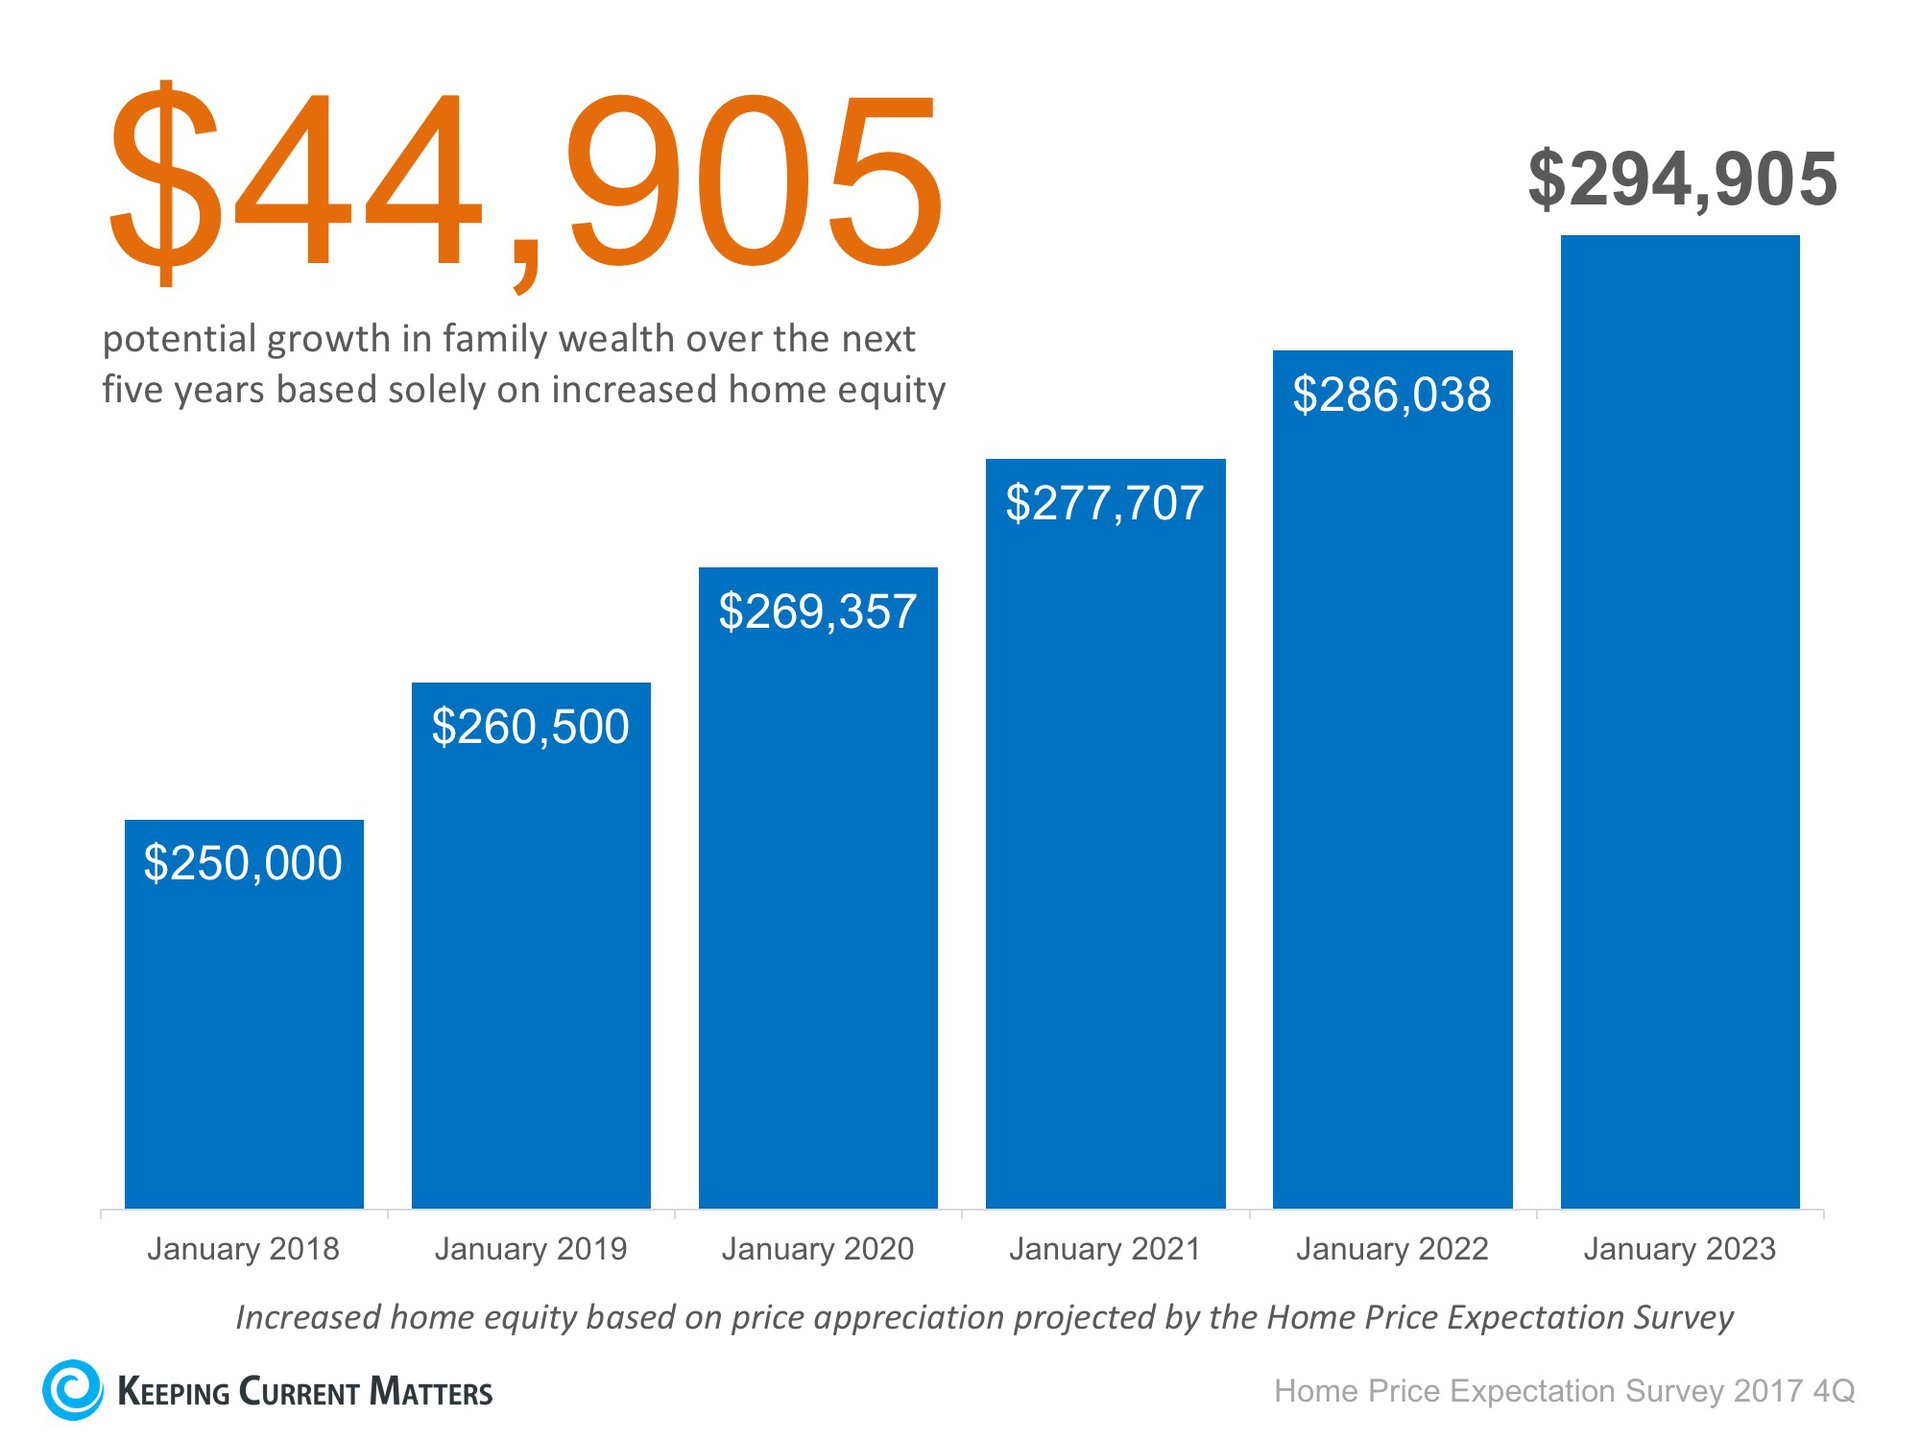
Since the experts predict that home prices will increase by 4.2% in 2018, the young homeowners will have gained $10,500 in equity in just one year.
Over a five-year period, their equity will increase by nearly $45,000! This figure does not even take into account their monthly principal mortgage payments. In many cases, home equity is one of the largest portions of a family’s overall net worth.
Bottom Line
Not only is homeownership something to be proud of, but it also offers you and your family the ability to build equity you can borrow against in the future. If you are ready and willing to buy, speak to a professional and find out if you are able to today!
First posted at windermere-bellevue.com
Home Buying •
January 31, 2018
Study Shows “Millennials Deserve More Credit”


When it comes to talking about millennials, there are many stereotypes out there that have influenced the way the public feels about the generation. Whether it’s the assumption that millennials are irresponsible with money and would rather buy avocado toast than save for a down payment, or that millennials jump from job to job, the majority of these stereotypes paint the generation in a negative light.
A new study by Bank of America entitled Better Money Habits Millennial Report recently came to the defense of the generation when it reported that:
“Millennials deserve more credit – both from themselves and from others – for their mindfulness when it comes to money and their lives.”
Here are some key takeaways from the study proving that millennials deserve more credit for what they are already doing:
- 63% are saving – (47% have $15,000 or more in savings)
- 54% are budgeting – (73% who have a budget stick to it every month)
- 57% have a savings goal – (67% who have a goal stick to it every month)
- 46% have asked for a raise in the past 2 years – (80% who asked for a raise got one)
- 59% feel financially secure – (16% have $100,000 or more in savings)
Many have wondered if millennials even want to own their own homes or if they would choose to rent instead. Well, not only do they want to own their own homes, but many already do and are looking to trade up! A recent study by realtor.com shows that 49% of Americans who plan to sell their home in the next 12 months are millennials!
Danielle Hale, realtor.com’s Chief Economist, gave some insight into why millennials are looking to sell,
“The housing shortage forced many first-time homebuyers to consider smaller homes and condos as a way to literally get their foot in the door. Our survey data reveals that we may see more of these homes hitting the market in the next year.”
Bottom Line
Not every millennial fits into the stereotypes that are so prominent in our society. Those who have risen above the stereotype are ready and willing to buy a home of their own, and many others already have!
First posted at www.mykcm.com.
Real Estate Tips •
December 28, 2017
3 Tips to buy your Dream Home

How to start saving to buy your Dream Home
- Save for your Dream Home: Setting up an automatic savings plan that saves a small amount of every check is one of the best ways to save without thinking a lot about it.
- Living within a budget: It will not only help you save money for down payments but will help you pay down other debts that might be holding you back

Originally posted at windermere-bellevue.com.
Market Stats • Real Estate News •
November 8, 2017
Greater Seattle Area Real Estate Market – 3rd Quarter 2017

The Gardner Report – Third Quarter 2017

ECONOMIC OVERVIEW
The Washington State economy added 79,600 new jobs over the past 12 months—an impressive growth rate of 2.4%, and well above the national growth rate of 1.2%. However, as we anticipated in last quarter’s report, we continue to see a modest slowdown in the growth rate as the state grows closer to full employment. Growth has been broad-based, with expansion in all major job sectors other than Aerospace (a function of a slowdown at Boeing). Given the current rate of expansion, I am raising my employment forecast and now predict that Washington will add 81,000 new jobs in 2017.
Given the robust job market, it is unsurprising that the state unemployment rate continues to fall. The current unemployment rate in Washington State is 4.6% and we are essentially at full employment. Additionally, all counties contained within this report reported either a drop or stability in their unemployment rate from a year ago. I maintain my belief that the Washington State economy will continue to outperform the U.S. as a whole. Given such a strong expansion, we should also expect solid income growth across Western Washington.
HOME SALES ACTIVITY
- There were 25,312 home sales during the third quarter of 2017. This is an increase of 3.6% over the same period in 2016.
- Clallam County maintains its number one position for sales growth over the past 12 months. Only four other counties saw double-digit gains in sales. This demonstrates continuing issues with the low supply of listings. There were modest declines in sales activity in six counties.
- The market remains remarkably tight with listing inventory down by 14.2% when compared to the third quarter of 2016. But inventory is up a significant 32% compared to the second quarter of this year. Pending sales rose by 5.2% over the same quarter a year ago, which suggests that closings in Q4 will still be robust.
- The key takeaway from this data is that inventory is still very low, and the situation is unlikely to improve through the balance of the year.

HOME PRICES
 Given tight supply levels, it is unsurprising to see very solid price growth across the Western Washington counties. Year-over-year, average prices rose 12.3% to $474,184. This is 0.9% higher than seen in the second quarter of this year.
- With demand far exceeding supply, price growth in Western Washington continues to trend well above the longterm average. As I do not expect to see the new home market expand at any significant pace, there will be continued pressure on the resale market, which will cause home prices to continue to rise at above-average rates.
- When compared to the same period a year ago, price growth was most pronounced in Grays Harbor County where sale prices were 20.1% higher than the third quarter of 2016. Nine additional counties experienced double-digit price growth.
- Mortgage rates in the quarter continue to test the lows of 2017, and this is unlikely to change in the near-term. This will allow home prices to escalate further but I expect we will see rates start to rise fairly modestly in 2018, which could slow price growth.
 Given tight supply levels, it is unsurprising to see very solid price growth across the Western Washington counties. Year-over-year, average prices rose 12.3% to $474,184. This is 0.9% higher than seen in the second quarter of this year.

DAYS ON MARKET
- The average number of days it took to sell a home in the quarter dropped by eight days when compared to the same quarter of 2016.
- King County continues to be the tightest market, with homes taking an average of 17 days to sell. Every county except San Juan saw the days on market drop from the same period a year ago.
- This quarter, it took an average of 43 days to sell a home. This is down from the 51 days it took in the second quarter of 2016 and down by 8 days from the second quarter of this year.
- At some point, inventory will start to grow and this will lead to an increase in the average time it takes to sell a house. However, I do not expect that to happen at any time soon. So we remain in a seller’s market.

CONCLUSIONS
 This speedometer reflects the state of the region’s housing market using housing inventory, price gains, home sales, interest rates, and larger economic factors. For the third quarter of 2017, I have left the needle at the same point as the second quarter. Though price growth remains robust, sales activity has slowed very slightly and listings jumped relative to the second quarter. That said, the market is very strong and buyers will continue to find significant competition for accurately priced and well-located homes.
ABOUT MATTHEW GARDNER
 Matthew Gardner is the Chief Economist for Windermere Real Estate, specializing in residential market analysis, commercial/industrial market analysis, financial analysis, and land use and regional economics. He is the former Principal of Gardner Economics, and has more than 30 years of professional experience both in the U.S. and U.K.
Posted on November 2, 2017 at 4:06 pm
Bellevue Commons Category: Market Stats, Windermere Bellevue Commons News Tagged bellevue, bellevue real estate, buy a home, buy or rent, cost of waiting, First Time Buyers, first time homebuyer loan, home, home price, home price increase, home selling, homebuyer, house, housing market, inventory, king county, local market, low inventory, market, market stats, month of supplies, property, real estate, real estate market, stats, time to sell, Western Washington Real Estate Market Update – Seattle – Bellevue, windermere
Bellevue Commons Category: Market Stats, Windermere Bellevue Commons News Tagged bellevue, bellevue real estate, buy a home, buy or rent, cost of waiting, First Time Buyers, first time homebuyer loan, home, home price, home price increase, home selling, homebuyer, house, housing market, inventory, king county, local market, low inventory, market, market stats, month of supplies, property, real estate, real estate market, stats, time to sell, Western Washington Real Estate Market Update – Seattle – Bellevue, windermere
