Home BuyingMarket StatsReal Estate Newsseattlewindermere August 8, 2018

What’s Happening in the Market in June 2018?

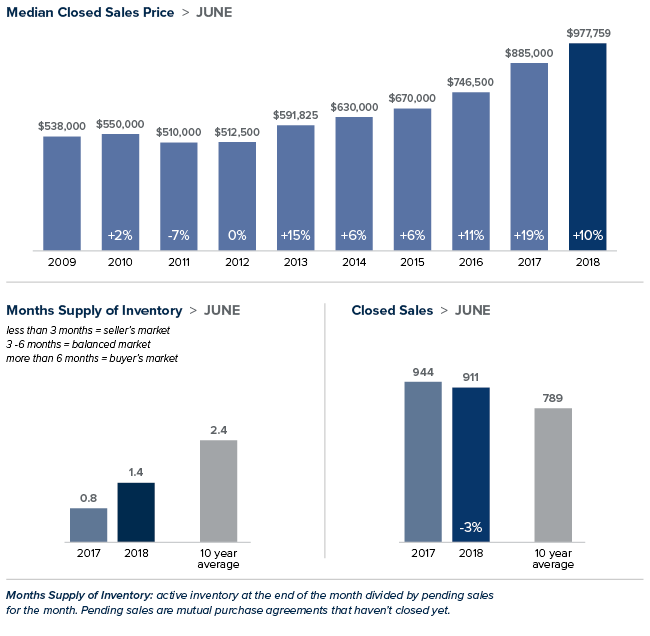
The local real estate market looks like it might finally be showing signs of softening, with inventory up and sales down. More sellers have opted to put their homes on the market. Inventory was up 47 percent in King County and price increases were in the single digits. Despite the increase in inventory and slowdown in sales, it’s still a solid seller’s market. Over half the properties purchased in June sold for more than list price.

Eastside

>>>Click image to view full report.


A booming economy offered little price relief for buyers looking on the Eastside. In a recent study of economic strength by state, Washington ranked number one in the country. An additional report targeting cities ranks the Seattle-Bellevue-Tacoma market as the nation’s fourth strongest economy. The median price of a single-family home on the Eastside rose 10 percent over a year ago to $977,759 setting another record. There is some good news for buyers. Inventory rose to its highest level in three years, with the number of homes for sale increasing 46 percent from the same time last year.

King County

>>>Click image to view full report.


The number of homes on the market in King County soared 47 percent from a year ago, the biggest increase since the housing bubble burst. Despite the increase, there is just over one month of available inventory, far short of the four to six months that is considered a balanced market. The median price of a single-family home increased 9 percent over last June to $715,000. That’s down 2 percent from the $726,275 median in May. Home prices haven’t dropped from May to June in King County since the last recession.

Seattle

>>>Click image to view full report.


Seattle trails only Bay Area cities when it comes to greatest profits for home sellers. That may help explain the surge in inventory in June. For example, the number of homes for sale in the popular Ballard/Green Lake area doubled from a year ago. Even though buyers are finally getting more choices, demand still exceeds supply. Homes sell faster in Seattle than in any other U.S. real estate market. That demand propelled the median price of a single-family home to $812,500; up 8 percent over last June and down from the record $830,000 set in May.

Snohomish County

>>>Click image to view full report.


The largest jump in home prices in the region came in Snohomish County. While higher-priced markets in King County are seeing increases slowing slightly, the median price of a single-family home here jumped 14 percent to $511,500, a new high for the county. Buyers willing to “keep driving until they can afford it” are finding Snohomish County an appealing destination.

 This post originally appeared on windermere-bellevue.com
Home BuyingMarket StatsReal Estate NewsReal Estate TipsseattleUncategorizedwindermereWindermere Bellevue Commons News | Tagged homeless August 8, 2018

How Will the Real Estate Market Respond to Rising Interest Rates?

Let Windermere Real Estate’s Chief Economist Matthew Gardner walk you through what to expect from the real estate market amidst rising interest rates.​

This post originally appeared on windermere-bellevue.com

Market StatsReal Estate Newsseattle July 26, 2018

How Facebook and Microsoft multi-million expansion projects are going to change Redmond?

Two IT giants are planning to expand their campuses in Redmond at the same time.

Facebook has spent $106 million on construction and development permits for Oculus offices in Redmond over the last three years. And in 2018 alone, Facebook spent $88.3 million on Oculus -related permits for as many as eight new offices in the area. BuildZoom’s analysis identifies five properties, in particular, all on Willow Road in Redmond, that span more than 90,000 square feet of lab and office space. Those locations are 10545 Willows Rd., 10785 Willows Rd., 9805 Willows Rd., 9845 Willows Rd. and 9461 Willow Road.

Microsoft will construct 18 new buildings on the campus over the next five to seven years,  which currently has 80. It will renovate several other buildings to give them a modern, open feel.

Home UpdateMarket StatsReal Estate NewswindermereWindermere Bellevue Commons News | Tagged homeless July 25, 2018

The Gardner Report – Second Quarter 2018

The following analysis of the Western Washington real estate market is provided by Windermere Real Estate Chief Economist Matthew Gardner. We hope that this information may assist you with making better-informed real estate decisions.

Economic Overview

The Washington State economy added 83,900 new jobs over the past 12 months, representing an annual growth rate of 2.5%. This is a slowdown from the last quarter, but employment growth remains well above the national rate of 1.6%. Employment gains continue to be robust in the private sector, which was up by 2.8%. The public sector (government) grew by a more modest 1.1%.

The strongest growth sectors were Retail Trade and Construction, which both rose by 4.8%. Significant growth was also seen in the Education & Health Services and Information sectors, which rose by 3.9% and 3.4%, respectively.

The State’s unemployment rate was 4.7%, down from 4.8% a year ago. Washington State will continue adding jobs for the balance of the year and I anticipate total job growth for 2018 will be around 80,000, representing a total employment growth rate of 2.4%.

Home Sales Activity

  • There were 23,209 home sales during the second quarter of 2018. This is a drop of 2.3% compared to the same period a year ago.

  • Clallam County saw sales rise the fastest relative to the same period a year ago, with an increase of 12.6%. Jefferson County also saw significant gains in sales at 11.1%.

  • The number of homes for sale last quarter was down by a nominal 0.3% when compared to the second quarter of 2017, but up by 66% when compared to the first quarter of this year. Much has been mentioned regarding the growth in listings, but it was not region-wide. King County saw a massive 31.7% increase in inventory, though all but three of the other counties covered in this report saw the number of listings drop compared to a year ago.

  • The takeaway from this data is that while some counties are seeing growth in listings — which will translate into sales down the road — the market is still out of balance.

Home Prices

  • Home prices continue to trend higher across Western Washington, but the pace of growth has started to slow. This should please would-be buyers. The spring market came late but inventory growth in the expensive King County market will give buyers more choices and likely lead to a slowing down of price growth as bidding wars continue to taper.

  • When compared to the same period a year ago, price growth was strongest in Mason County, which was up 17.4%. Eleven other counties experienced double-digit price growth.

  • Mortgage rates, which had been rising significantly since the start of the year, have levelled off over the past month. I believe rising rates are likely the reason that inventory levels are rising, as would-be sellers believe that this could be the right time to cash out. That said, the slowing in rate increases has led buyers to believe that rates will not jump soon, which gives them a little more breathing room. I do not expect to see any possible slowdown in demand until mortgage rates breach the 5% mark.

Days on Market

  • The average number of days it took to sell a home dropped by seven days compared to the same quarter of 2017.

  • King County continues to be the tightest market in Western Washington, with homes taking an average of only 13 days to sell. Every county in the region other than Clallam saw the length of time it took to sell a home drop when compared to the same period a year ago.

  • Across the entire region, it took an average of 41 days to sell a home in the second quarter of this year. This is down from 48 days in the second quarter of 2017 and down by 20 days when compared to the first quarter of 2018.

  • Although we did see some inventory increases when compared to the first quarter of the year, we are essentially at the same level of homes on the market as a year ago. The market has yet to reach equilibrium and I certainly do not expect to reach that point until sometime in 2019.

Conclusions

This speedometer reflects the state of the region’s real estate market using housing inventory, price gains, home sales, interest rates, and larger economic factors. For the second quarter of 2018, I have moved the needle very slightly towards buyers, but it remains firmly a seller’s market. This shift is a function of price growth tapering very slightly, as well as the expectation that we should see more homes come on the market as we move through the balance of the year.


Matthew Gardner is the Chief Economist for Windermere Real Estate, specializing in residential market analysis, commercial/industrial market analysis, financial analysis, and land use and regional economics. He is the former Principal of Gardner Economics, and has more than 30 years of professional experience both in the U.S. and U.K.


This post originally appeared on the Windermere.com Blog.

Home BuyingMarket StatsReal Estate Newsseattle July 18, 2018

Eastside Statistics Slideshow Template – July 2018

Market StatsReal Estate NewsseattlewindermereWindermere Bellevue Commons News | Tagged homeless July 18, 2018

Eastside Statistics Slideshow Template – July 2018

Market StatsReal Estate Newsseattle June 13, 2018

What’s Happening in the Market in May 2018?

Here are the Current stats via “What’s Happening in the Market” for the month of May 2018 for Eastside (based on Residential and Condominium report):

  • Is the market shifting? It is too early to call and the real estate statistics show demand still far exceeding supply, however still low, there has been a significant increase in inventory.
  • Number of properties for sale is increasing:

o             1,230 active properties for sale is the highest number in the past 20 months or since August 2016.

o             Active inventory is up 350 properties or 40% compared to a year ago (May 2018 = 1,230 vs May 2017 = 880)

  • Statistics indicating more demand than supply:

o             Less than one month’s supply of inventory.

             0.9 May 2018 vs 0.6 May 2017 vs 0.8 May 2016 vs 1.1 May 2015

o             Sales prices on closed May sales are up 14% to $859,950 vs $753,750 May 2017.

o             58% of houses sold over list price compared to 62% in April 2018 and 61% in May 2017

The increased inventory means Sellers and listing brokers will need to consider active competition.  Condition, marketing and pricing will be more important with rising inventory.

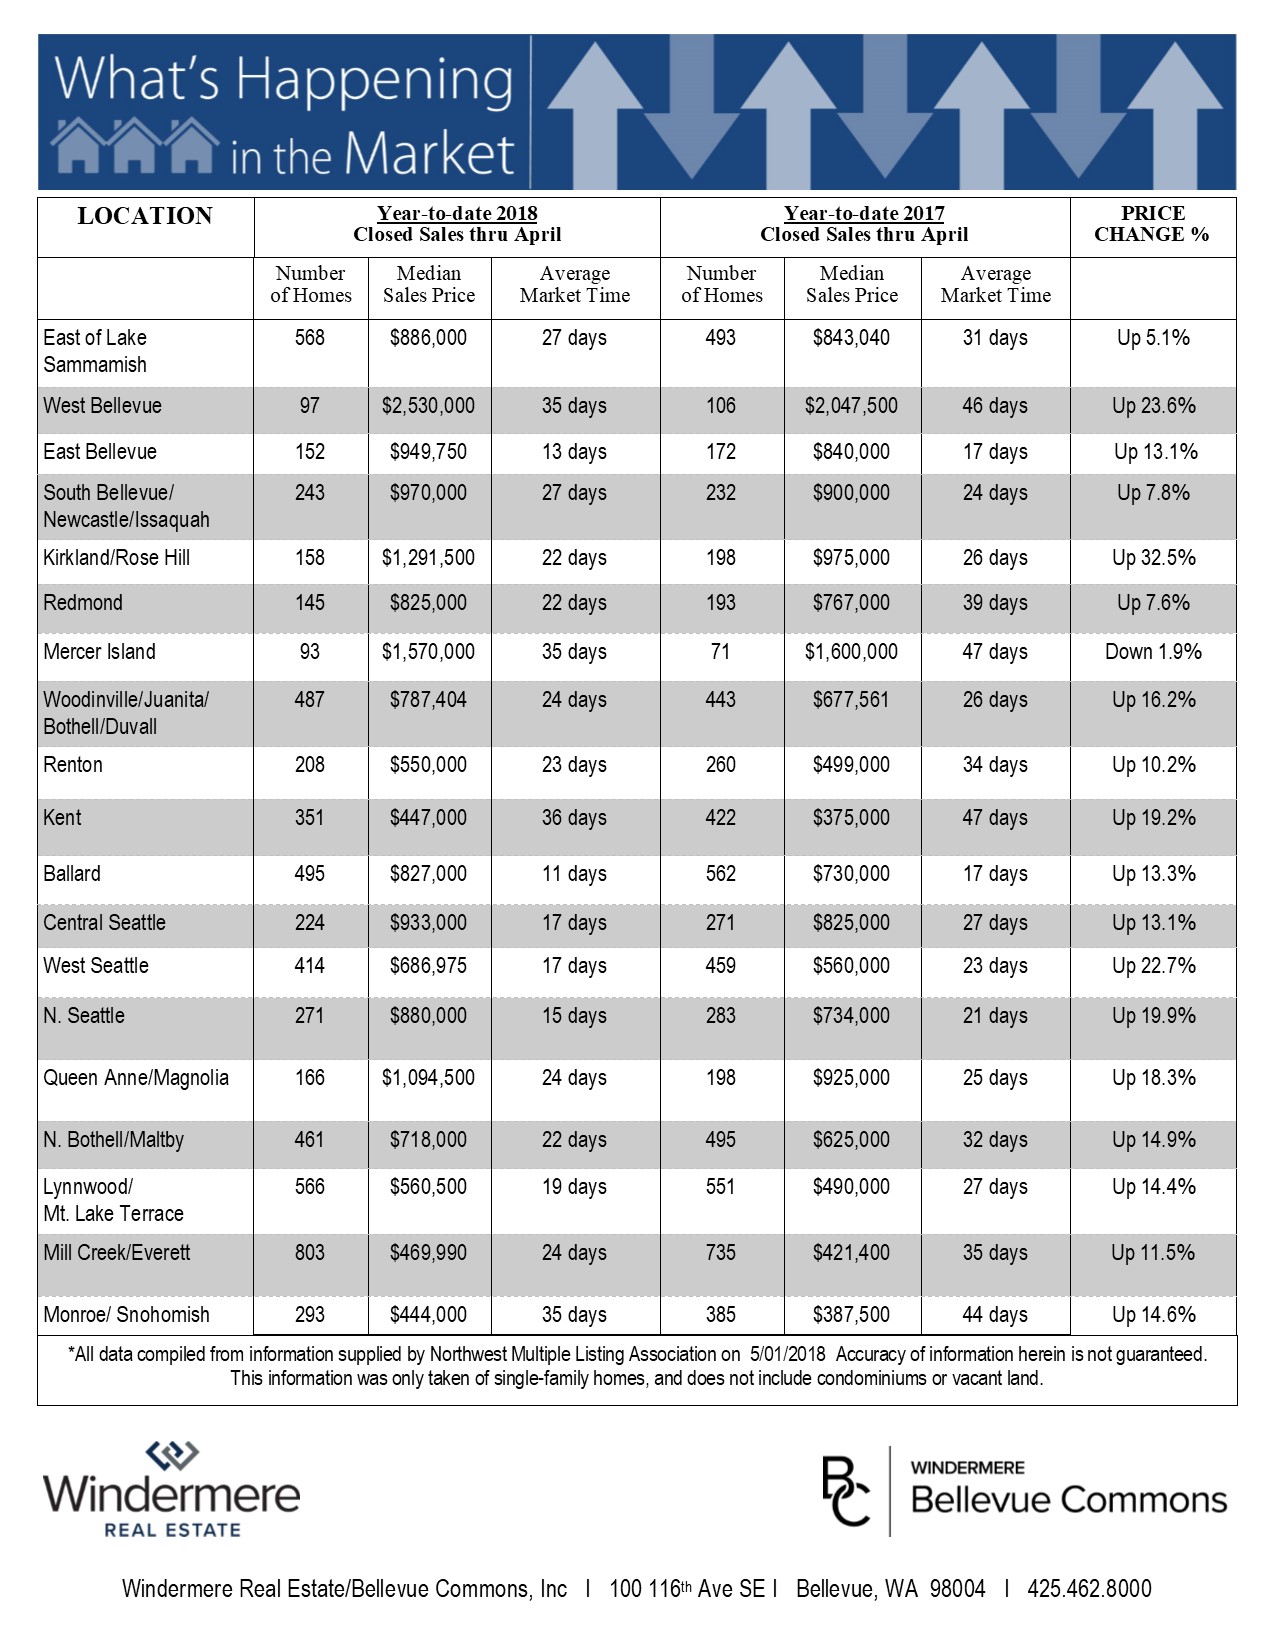
April-2018-YTD-Residential-Stats.jpg

Real Estate Tipsseattlewindermere June 11, 2018

The Oleg Group Vlog

I am excited to share the First Episode of my Vlog. In this video you’ll see what I’ve been up to last month, learn why Kirkland’s residential price went up 32.5% (the highest price change in King County) within a year and why people love this beautiful city.

In the next episodes, I will be showing you other cities in WA state. Subscribe to my Youtube channel and stay tuned for the next episode!

Home BuyingMarket StatsReal Estate News May 9, 2018

How to Get Back to a Balanced Housing Market

Developers are not building enough single-family homes to keep up with demand. The reason why? Cost. Windermere’s Chief Economist, Matthew Gardner explains why new construction is so cost prohibitive and how to shift the trend.


First posted at Windermere.com

Home Buying May 9, 2018

How Rising Prices Will Help You Build Family Wealth In 2018

Homeowners can build wealth by purchasing a home. Over the next five years, home prices are expected to appreciate on average by 3.35% per year and to grow by 24.34% cumulatively, according to Pulsenomics’ most recent Home Price Expectation Survey.

So, what does this mean for homeowners and their equity position?

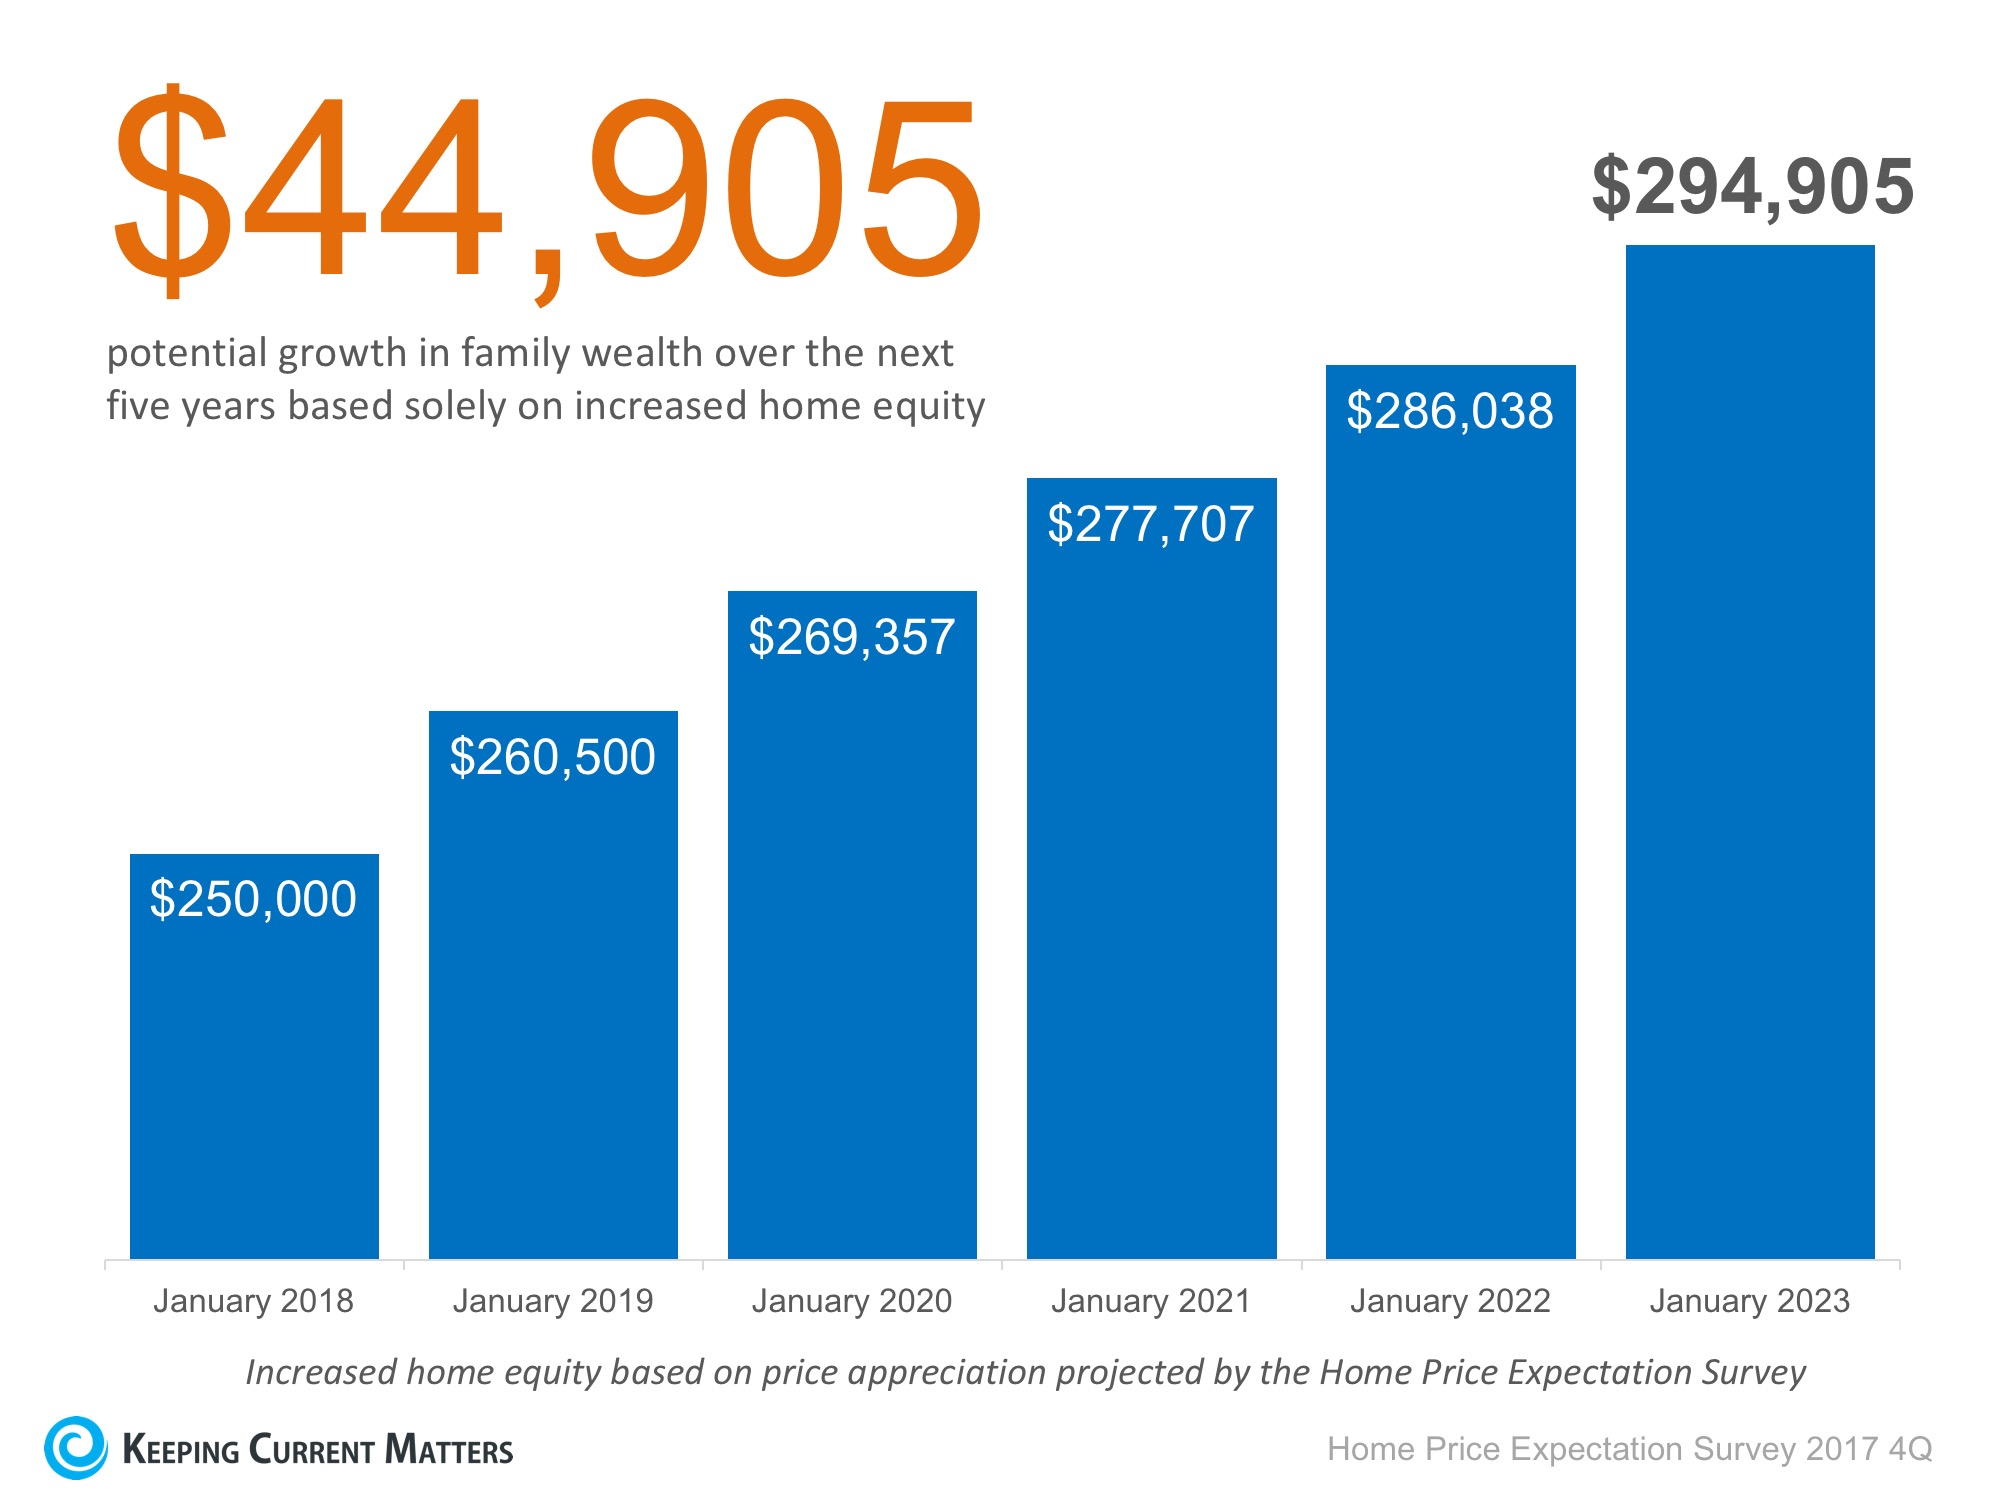
As an example, let’s assume a young couple purchases and closes on a $250,000 home this month (January). If we only look at the projected increase in the price of that home, how much equity will they earn over the next 5 years?

How Rising Prices Will Help You Build Family Wealth in 2018 | Keeping Current Matters

Since the experts predict that home prices will increase by 4.2% in 2018, the young homeowners will have gained $10,500 in equity in just one year.

Over a five-year period, their equity will increase by nearly $45,000! This figure does not even take into account their monthly principal mortgage payments. In many cases, home equity is one of the largest portions of a family’s overall net worth.

Bottom Line

Not only is homeownership something to be proud of, but it also offers you and your family the ability to build equity you can borrow against in the future. If you are ready and willing to buy, speak to a professional and find out if you are able to today!

First posted at windermere-bellevue.com