Facebook
 X
X
 Pinterest
 Copy Link


The following analysis of the Western Washington real estate market is provided by Windermere Real Estate Chief Economist Matthew Gardner. We hope that this information may assist you with making better-informed real estate decisions.
Economic Overview
The Washington State economy added 83,900 new jobs over the past 12 months, representing an annual growth rate of 2.5%. This is a slowdown from the last quarter, but employment growth remains well above the national rate of 1.6%. Employment gains continue to be robust in the private sector, which was up by 2.8%. The public sector (government) grew by a more modest 1.1%.
The strongest growth sectors were Retail Trade and Construction, which both rose by 4.8%. Significant growth was also seen in the Education & Health Services and Information sectors, which rose by 3.9% and 3.4%, respectively.
The State’s unemployment rate was 4.7%, down from 4.8% a year ago. Washington State will continue adding jobs for the balance of the year and I anticipate total job growth for 2018 will be around 80,000, representing a total employment growth rate of 2.4%.
Home Sales Activity
-
There were 23,209 home sales during the second quarter of 2018. This is a drop of 2.3% compared to the same period a year ago.
-
Clallam County saw sales rise the fastest relative to the same period a year ago, with an increase of 12.6%. Jefferson County also saw significant gains in sales at 11.1%.
-
The number of homes for sale last quarter was down by a nominal 0.3% when compared to the second quarter of 2017, but up by 66% when compared to the first quarter of this year. Much has been mentioned regarding the growth in listings, but it was not region-wide. King County saw a massive 31.7% increase in inventory, though all but three of the other counties covered in this report saw the number of listings drop compared to a year ago.
-
The takeaway from this data is that while some counties are seeing growth in listings — which will translate into sales down the road — the market is still out of balance.

Home Prices
-
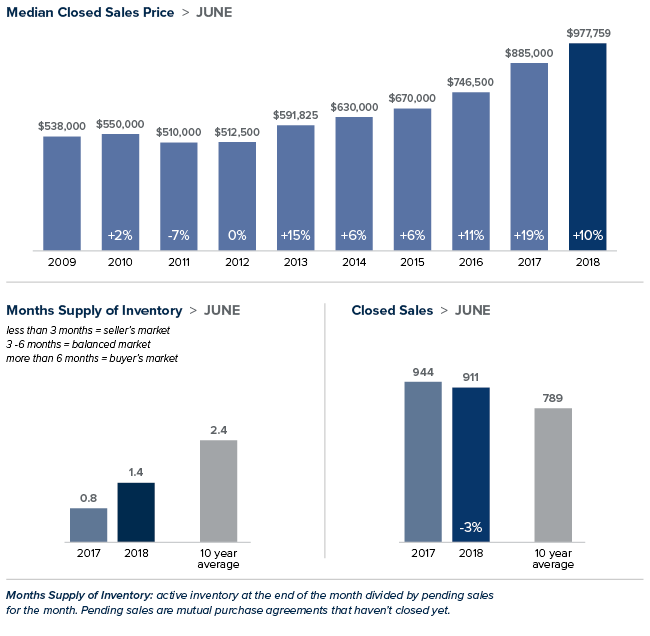
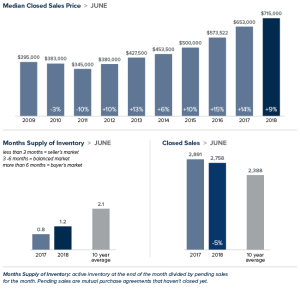
![HomePrice Change Map Q2]() As inventory is still fairly scarce, growth in home prices continues to trend well above the long-term average. Prices in Western Washington rose 12.2% over last year to $526,398.
As inventory is still fairly scarce, growth in home prices continues to trend well above the long-term average. Prices in Western Washington rose 12.2% over last year to $526,398. -
Home prices continue to trend higher across Western Washington, but the pace of growth has started to slow. This should please would-be buyers. The spring market came late but inventory growth in the expensive King County market will give buyers more choices and likely lead to a slowing down of price growth as bidding wars continue to taper.
-
When compared to the same period a year ago, price growth was strongest in Mason County, which was up 17.4%. Eleven other counties experienced double-digit price growth.
-
Mortgage rates, which had been rising significantly since the start of the year, have levelled off over the past month. I believe rising rates are likely the reason that inventory levels are rising, as would-be sellers believe that this could be the right time to cash out. That said, the slowing in rate increases has led buyers to believe that rates will not jump soon, which gives them a little more breathing room. I do not expect to see any possible slowdown in demand until mortgage rates breach the 5% mark.
 As inventory is still fairly scarce, growth in home prices continues to trend well above the long-term average. Prices in Western Washington rose 12.2% over last year to $526,398.
Days on Market
-
The average number of days it took to sell a home dropped by seven days compared to the same quarter of 2017.
-
King County continues to be the tightest market in Western Washington, with homes taking an average of only 13 days to sell. Every county in the region other than Clallam saw the length of time it took to sell a home drop when compared to the same period a year ago.
-
Across the entire region, it took an average of 41 days to sell a home in the second quarter of this year. This is down from 48 days in the second quarter of 2017 and down by 20 days when compared to the first quarter of 2018.
-
Although we did see some inventory increases when compared to the first quarter of the year, we are essentially at the same level of homes on the market as a year ago. The market has yet to reach equilibrium and I certainly do not expect to reach that point until sometime in 2019.

Conclusions

This speedometer reflects the state of the region’s real estate market using housing inventory, price gains, home sales, interest rates, and larger economic factors. For the second quarter of 2018, I have moved the needle very slightly towards buyers, but it remains firmly a seller’s market. This shift is a function of price growth tapering very slightly, as well as the expectation that we should see more homes come on the market as we move through the balance of the year.