
 Facebook
 X
X
 Pinterest
 Copy Link


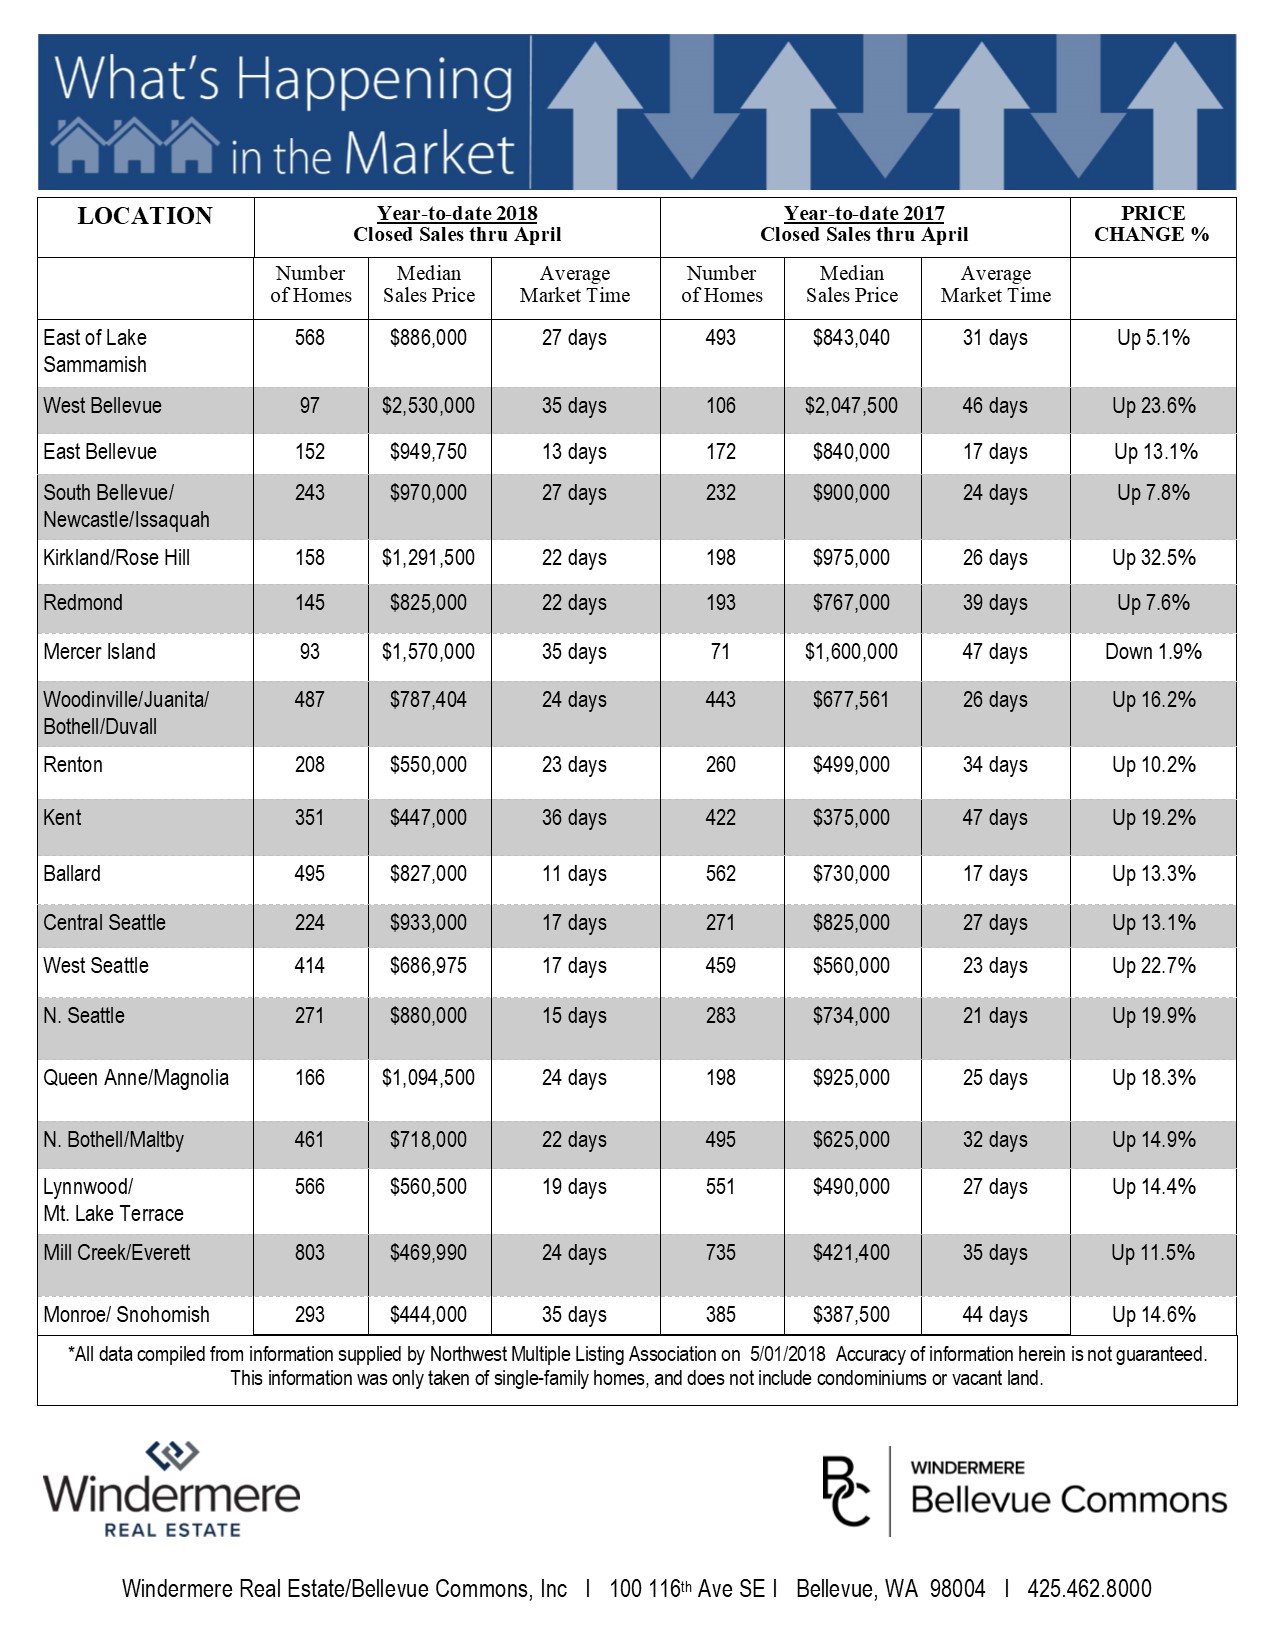

The Gardner Report – Third Quarter 2017

ECONOMIC OVERVIEW
The Washington State economy added 79,600 new jobs over the past 12 months—an impressive growth rate of 2.4%, and well above the national growth rate of 1.2%. However, as we anticipated in last quarter’s report, we continue to see a modest slowdown in the growth rate as the state grows closer to full employment. Growth has been broad-based, with expansion in all major job sectors other than Aerospace (a function of a slowdown at Boeing). Given the current rate of expansion, I am raising my employment forecast and now predict that Washington will add 81,000 new jobs in 2017.
Given the robust job market, it is unsurprising that the state unemployment rate continues to fall. The current unemployment rate in Washington State is 4.6% and we are essentially at full employment. Additionally, all counties contained within this report reported either a drop or stability in their unemployment rate from a year ago. I maintain my belief that the Washington State economy will continue to outperform the U.S. as a whole. Given such a strong expansion, we should also expect solid income growth across Western Washington.
HOME SALES ACTIVITY
- There were 25,312 home sales during the third quarter of 2017. This is an increase of 3.6% over the same period in 2016.
- Clallam County maintains its number one position for sales growth over the past 12 months. Only four other counties saw double-digit gains in sales. This demonstrates continuing issues with the low supply of listings. There were modest declines in sales activity in six counties.
- The market remains remarkably tight with listing inventory down by 14.2% when compared to the third quarter of 2016. But inventory is up a significant 32% compared to the second quarter of this year. Pending sales rose by 5.2% over the same quarter a year ago, which suggests that closings in Q4 will still be robust.
- The key takeaway from this data is that inventory is still very low, and the situation is unlikely to improve through the balance of the year.

HOME PRICES
 Given tight supply levels, it is unsurprising to see very solid price growth across the Western Washington counties. Year-over-year, average prices rose 12.3% to $474,184. This is 0.9% higher than seen in the second quarter of this year.
- With demand far exceeding supply, price growth in Western Washington continues to trend well above the longterm average. As I do not expect to see the new home market expand at any significant pace, there will be continued pressure on the resale market, which will cause home prices to continue to rise at above-average rates.
- When compared to the same period a year ago, price growth was most pronounced in Grays Harbor County where sale prices were 20.1% higher than the third quarter of 2016. Nine additional counties experienced double-digit price growth.
- Mortgage rates in the quarter continue to test the lows of 2017, and this is unlikely to change in the near-term. This will allow home prices to escalate further but I expect we will see rates start to rise fairly modestly in 2018, which could slow price growth.
 Given tight supply levels, it is unsurprising to see very solid price growth across the Western Washington counties. Year-over-year, average prices rose 12.3% to $474,184. This is 0.9% higher than seen in the second quarter of this year.

DAYS ON MARKET
- The average number of days it took to sell a home in the quarter dropped by eight days when compared to the same quarter of 2016.
- King County continues to be the tightest market, with homes taking an average of 17 days to sell. Every county except San Juan saw the days on market drop from the same period a year ago.
- This quarter, it took an average of 43 days to sell a home. This is down from the 51 days it took in the second quarter of 2016 and down by 8 days from the second quarter of this year.
- At some point, inventory will start to grow and this will lead to an increase in the average time it takes to sell a house. However, I do not expect that to happen at any time soon. So we remain in a seller’s market.

CONCLUSIONS
 This speedometer reflects the state of the region’s housing market using housing inventory, price gains, home sales, interest rates, and larger economic factors. For the third quarter of 2017, I have left the needle at the same point as the second quarter. Though price growth remains robust, sales activity has slowed very slightly and listings jumped relative to the second quarter. That said, the market is very strong and buyers will continue to find significant competition for accurately priced and well-located homes.
ABOUT MATTHEW GARDNER
 Matthew Gardner is the Chief Economist for Windermere Real Estate, specializing in residential market analysis, commercial/industrial market analysis, financial analysis, and land use and regional economics. He is the former Principal of Gardner Economics, and has more than 30 years of professional experience both in the U.S. and U.K.
