Home BuyingMarket StatsReal Estate NewsReal Estate TipsseattleWindermere Bellevue Commons NewsWindermere Bellevue Commons News | Tagged homeless July 24, 2023

Seattle & Bellevue Real Estate Market Update: February 2023

Seattle & Bellevue Real Estate Market Update: February 2023

In February 2023, Seattle and Bellevue, WA continue to be strong housing markets. With a population of 3.9 million, the Seattle-Tacoma metropolitan area is the 15th largest in the United States. The area continues to benefit from its diverse economy, which is driven by technology, manufacturing, and health care. The Seattle-Bellevue housing market remains competitive. Home prices have increased by 2% percent in the past year, with an average listing price of $803,750.

Home BuyingMarket StatsReal Estate NewsseattleWindermere Bellevue Commons NewsWindermere Bellevue Commons News | Tagged homeless July 31, 2019

Gardner Report Q2 2019

The following analysis of the Western Washington real estate market is provided by Windermere Real Estate Chief Economist Matthew Gardner. We hope that this information may assist you with making better-informed real estate decisions. For further information about the housing market in your area, please don’t hesitate to contact your Windermere agent.

Economic Overview

Washington State employment jumped back up to an annual growth rate of 2.4% following a disappointing slowdown earlier in the spring. As stated in the first quarter Gardner Report, the dismal numbers earlier this year were a function of the state re-benchmarking its data (which they do annually).

The state unemployment rate was 4.7%, marginally up from 4.5% a year ago. My current economic forecast suggests that statewide job growth in 2019 will rise by 2.6%, with a total of 87,500 new jobs created.

Home Sales Activity

  • There were 22,281 home sales during the second quarter of 2019, representing a drop of 4.8% from the same period in 2018. On a more positive note, sales jumped 67.6% compared to the first quarter of this year.
  • Since the middle of last year, there has been a rapid rise in the number of homes for sale, which is likely the reason sales have slowed. More choice means buyers can be more selective and take their time when choosing a home to buy.
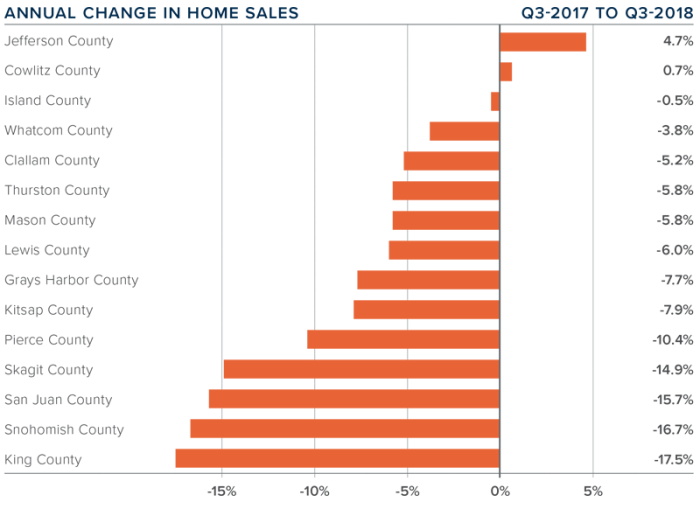
  • Compared to the second quarter of 2018, there were fewer sales in all counties except Whatcom and Lewis. The greatest declines were in Clallam, San Juan, and Jefferson counties.
  • Listings rose 19% compared to the second quarter of 2018, but there are still a number of very tight markets where inventory levels are lower than a year ago. Generally, these are the smaller — and more affordable — markets, which suggests that affordability remains an issue.

Home Prices

  • Year-over-year price growth in Western Washington continues to taper. The average home price during second quarter was $540,781, which is 2.8% higher than a year ago. When compared to first quarter of this year, prices were up 12%.

  • Home prices were higher in every county except King, which is unsurprising given the cost of homes in that area. Even though King County is home to the majority of jobs in the region, housing is out of reach for many and I anticipate that this will continue to act as a drag on price growth.
  • When compared to the same period a year ago, price growth was strongest in Lewis County, where home prices were up 15.9%. Double-digit price increases were also seen in Mason, Cowlitz, Grays Harbor, and Skagit counties.
  • The region’s economy remains robust, which should be a positive influence on price growth. That said, affordability issues are pervasive and will act as a headwind through the balance of the year, especially in those markets that are close to job centers. This will likely force some buyers to look further afield when searching for a new home.

Days on Market

  • The average number of days it took to sell a home matched the second quarter of 2018.
  • Snohomish County was the tightest market in Western Washington, with homes taking an average of only 21 days to sell. There were five counties where the length of time it took to sell a home dropped compared to the same period a year ago. Market time rose in eight counties and two were unchanged.
  • Across the entire region, it took an average of 41 days to sell a home in the second quarter of 2019. This was the same as a year ago but is down 20 days compared to the first quarter of 2019.
  • As stated above, days-on-market dropped as we moved through the spring, but all markets are not equal. I suggest that this is not too much of an issue and that well-priced homes will continue to attract attention and sell fairly rapidly.

Conclusions


This speedometer reflects the state of the region’s real estate market using housing inventory, price gains, home sales, interest rates, and larger economic factors. I am leaving the needle in the same position as the first quarter as demand appears to still be strong. The market has benefited from a fairly significant drop in mortgage rates. With average 30-year fixed rates still below 4%, I expect buyers who have been sitting on the fence will become more active, especially given that they have more homes to choose from.

As Chief Economist for Windermere Real Estate, Matthew Gardner is responsible for analyzing and interpreting economic data and its impact on the real estate market on both a local and national level. Matthew has over 30 years of professional experience both in the U.S. and U.K.

In addition to his day-to-day responsibilities, Matthew sits on the Washington State Governors Council of Economic Advisors; chairs the Board of Trustees at the Washington Center for Real Estate Research at the University of Washington; and is an Advisory Board Member at the Runstad Center for Real Estate Studies at the University of Washington where he also lectures in real estate economics.

This post originally appeared on the Windermere.com Blog.

First posted on windermere-bellevue.com


Fanatical NewsHome BuyingMarket StatsReal Estate NewsReal Estate TipsseattlewindermereWindermere Bellevue Commons News October 31, 2018

Western Washington Real Estate Market Update

The following analysis of the Western Washington real estate market is provided by Windermere Real Estate Chief Economist Matthew Gardner. We hope that this information may assist you with making better-informed real estate decisions. For further information about the housing market in your area, please don’t hesitate to contact your Windermere Agent. 

Economic Overview

Washington State continues to be one of the fastest growing states in the nation and there is little to suggest that there will be any marked slowdown in the foreseeable future. Over the past year, the state has added 105,900 new jobs, representing an annual growth rate of 3.2%. This remains well above the national rate of 1.65%. Private sector employment gains continue to be robust, increasing at an annual rate of 3.7%. The strongest growth sectors were Construction (+7.4%), Information (+6.2%), and Professional & Business Services (+6.1%). The state’s unemployment rate was 4.5%, down from 4.8% a year ago.

All year I’ve been predicting that Washington State’s annual job growth would outperform the nation as a whole, and we now know with certainty that this is going to be the case. Furthermore, I am now able to predict that statewide job growth in 2019 will be equally strong, with an expected increase of 2.6%.

Home Sales Activity

  • There were 22,310 home sales during the third quarter of 2018. This is a significant drop of 12.7% compared to the third quarter of 2017.

  • The number of homes for sale last quarter was up 14.5% compared to the third quarter of 2017, continuing a trend that started earlier in the year. However, the increase in listings was only in Seattle’s tri-county area (King, Pierce, and Snohomish Counties) while listing activity was down across the balance of the region.

  • Only two counties had a year-over-year increase in home sales, while the rest of Western Washington saw sales decrease.

  • The region has reached an inflection point. With the increase in the number of homes for sale, buyers now have more choices and time to make  a decision about what home to buy.

Home Prices

  • Home prices, although higher than a year ago, continue to slow due to the significant increase in the number of homes for sale. This, in my opinion, is a very good thing.

  • When compared to the same period a year ago, price growth was strongest in Lewis County, where home prices were up 15.3%. Six other counties experienced double-digit price increases.

  • Slowing price growth was inevitable; we simply could not sustain the increases we’ve experienced in recent years. Lower rates of appreciation will continue until wage growth catches up.

Days on Market

  • The average number of days it took to sell a home dropped by four days compared to the same quarter of 2017.

  • Across the entire region, it took an average of 39 days to sell a home in the third quarter of this year. This is down from 43 days in the third quarter of 2017 and down 2 days when compared to the second quarter of 2018.
  • King County continues to be the tightest market in Western Washington, with homes taking an average of only 19 days to sell. Every county in the region other than Skagit and King — which both saw the time on the market rise by 2 days — saw the length of time it took to sell a home drop when compared to the same period a year ago.

  • More choice in the market would normally suggest that the length of time it takes to sell a home should rise, but the data has yet to show that. That said, compared to last quarter, we are seeing some marked increases in days on market in several counties, which will be reflected in future reports.

Conclusions

This speedometer reflects the state of the region’s real estate market using housing inventory, price gains, home sales, interest rates, and larger economic factors. I started to move the needle toward buyers last quarter and have moved it even further this quarter. Price growth continues to slow, but more significant is the rise in listings, which I expect to continue as we move toward the quieter winter period.

I believe that psychology will start to play a part in the housing market going forward. It has been more than 15 years since we’ve experienced a “balanced” market, so many home buyers and sellers have a hard time remembering what one looks like. Concerns over price drops are overrated and the length of time it’s taking to sell a home is simply trending back to where it used to be in the early 2000s.


Matthew Gardner is the Chief Economist for Windermere Real Estate, specializing in residential market analysis, commercial/industrial market analysis, financial analysis, and land use and regional economics. He is the former Principal of Gardner Economics, and has more than 30 years of professional experience both in the U.S. and U.K.


This post originally appeared on the Windermere.com Blog.

First posted on windermere-bellevue.com.
Market StatsReal Estate News November 8, 2017

Greater Seattle Area Real Estate Market – 3rd Quarter 2017

The Gardner Report – Third Quarter 2017


ECONOMIC OVERVIEW

The Washington State economy added 79,600 new jobs over the past 12 months—an impressive growth rate of 2.4%, and well above the national growth rate of 1.2%. However, as we anticipated in last quarter’s report, we continue to see a modest slowdown in the growth rate as the state grows closer to full employment. Growth has been broad-based, with expansion in all major job sectors other than Aerospace (a function of a slowdown at Boeing). Given the current rate of expansion, I am raising my employment forecast and now predict that Washington will add 81,000 new jobs in 2017.

Given the robust job market, it is unsurprising that the state unemployment rate continues to fall. The current unemployment rate in Washington State is 4.6% and we are essentially at full employment. Additionally, all counties contained within this report reported either a drop or stability in their unemployment rate from a year ago. I maintain my belief that the Washington State economy will continue to outperform the U.S. as a whole. Given such a strong expansion, we should also expect solid income growth across Western Washington.


HOME SALES ACTIVITY

  • There were 25,312 home sales during the third quarter of 2017. This is an increase of 3.6% over the same period in 2016.
  • Clallam County maintains its number one position for sales growth over the past 12 months. Only four other counties saw double-digit gains in sales. This demonstrates continuing issues with the low supply of listings. There were modest declines in sales activity in six counties.
  • The market remains remarkably tight with listing inventory down by 14.2% when compared to the third quarter of 2016. But inventory is up a significant 32% compared to the second quarter of this year. Pending sales rose by 5.2% over the same quarter a year ago, which suggests that closings in Q4 will still be robust.
  • The key takeaway from this data is that inventory is still very low, and the situation is unlikely to improve through the balance of the year.


HOME PRICES

  • Given tight supply levels, it is unsurprising to see very solid price growth across the Western Washington counties. Year-over-year, average prices rose 12.3% to $474,184. This is 0.9% higher than seen in the second quarter of this year.
  • With demand far exceeding supply, price growth in Western Washington continues to trend well above the longterm average. As I do not expect to see the new home market expand at any significant pace, there will be continued pressure on the resale market, which will cause home prices to continue to rise at above-average rates.
  • When compared to the same period a year ago, price growth was most pronounced in Grays Harbor County where sale prices were 20.1% higher than the third quarter of 2016. Nine additional counties experienced double-digit price growth.
  • Mortgage rates in the quarter continue to test the lows of 2017, and this is unlikely to change in the near-term. This will allow home prices to escalate further but I expect we will see rates start to rise fairly modestly in 2018, which could slow price growth.


DAYS ON MARKET

  • The average number of days it took to sell a home in the quarter dropped by eight days when compared to the same quarter of 2016.
  • King County continues to be the tightest market, with homes taking an average of 17 days to sell. Every county except San Juan saw the days on market drop from the same period a year ago.
  • This quarter, it took an average of 43 days to sell a home. This is down from the 51 days it took in the second quarter of 2016 and down by 8 days from the second quarter of this year.
  • At some point, inventory will start to grow and this will lead to an increase in the average time it takes to sell a house. However, I do not expect that to happen at any time soon. So we remain in a seller’s market.


CONCLUSIONS

This speedometer reflects the state of the region’s housing market using housing inventory, price gains, home sales, interest rates, and larger economic factors. For the third quarter of 2017, I have left the needle at the same point as the second quarter. Though price growth remains robust, sales activity has slowed very slightly and listings jumped relative to the second quarter. That said, the market is very strong and buyers will continue to find significant competition for accurately priced and well-located homes.


ABOUT MATTHEW GARDNER

Matthew Gardner is the Chief Economist for Windermere Real Estate, specializing in residential market analysis, commercial/industrial market analysis, financial analysis, and land use and regional economics. He is the former Principal of Gardner Economics, and has more than 30 years of professional experience both in the U.S. and U.K.


Posted on November 2, 2017 at 4:06 pm
Bellevue Commons | Category: Market StatsWindermere Bellevue Commons News | Tagged