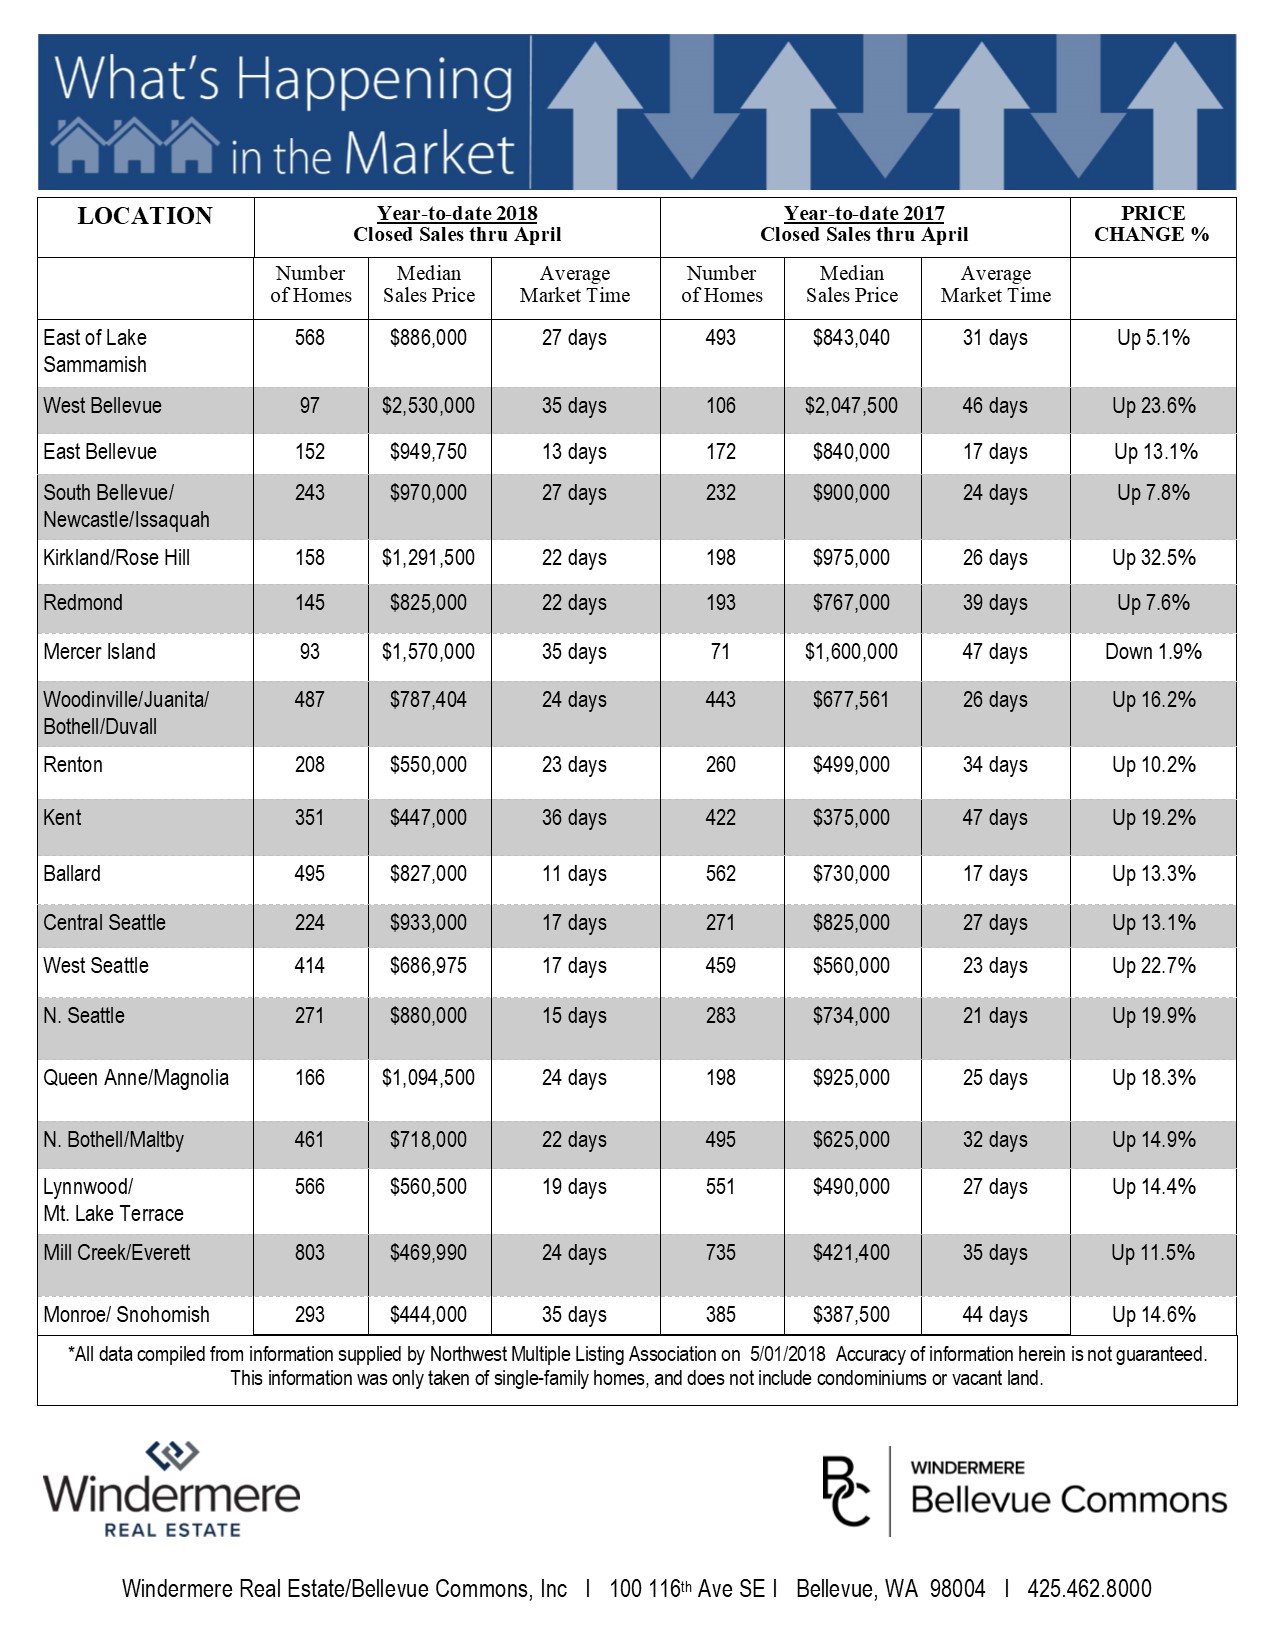
April 2018 active inventory rose 25% from March 31 2018 and 17% from April 2017.
Historically listings taken and active listings at the end of the month grow from April through July. In addition the majority of the year’s appreciation occurs in the first six months.
What does this mean:
Buyers can be a little more picky, more listings are coming, but they still are going to have to be aggressive with their offers
62% sold for over list price and 83.4% sold in less than 15 days. However these are the properties that sold.
April 2018 active inventory rose 25% from March 31 2018 and 17% from April 2017.
Sellers may want to be cautious about pushing their asking price.
Developers are not building enough single-family homes to keep up with demand. The reason why? Cost. Windermere’s Chief Economist, Matthew Gardner explains why new construction is so cost prohibitive and how to shift the trend.
When it comes to talking about millennials, there are many stereotypes out there that have influenced the way the public feels about the generation. Whether it’s the assumption that millennials are irresponsible with money and would rather buy avocado toast than save for a down payment, or that millennials jump from job to job, the majority of these stereotypes paint the generation in a negative light.
“Millennials deserve more credit – both from themselves and from others – for their mindfulness when it comes to money and their lives.”
Here are some key takeaways from the study proving that millennials deserve more credit for what they are already doing:
63% are saving – (47% have $15,000 or more in savings)
54% are budgeting – (73% who have a budget stick to it every month)
57% have a savings goal – (67% who have a goal stick to it every month)
46% have asked for a raise in the past 2 years – (80% who asked for a raise got one)
59% feel financially secure – (16% have $100,000 or more in savings)
Many have wondered if millennials even want to own their own homes or if they would choose to rent instead. Well, not only do they want to own their own homes, but many already do and are looking to trade up! A recent study by realtor.com shows that 49% of Americans who plan to sell their home in the next 12 months are millennials!
Danielle Hale, realtor.com’s Chief Economist, gave some insight into why millennials are looking to sell,
“The housing shortage forced many first-time homebuyers to consider smaller homes and condos as a way to literally get their foot in the door. Our survey data reveals that we may see more of these homes hitting the market in the next year.”
Bottom Line
Not every millennial fits into the stereotypes that are so prominent in our society. Those who have risen above the stereotype are ready and willing to buy a home of their own, and many others already have!
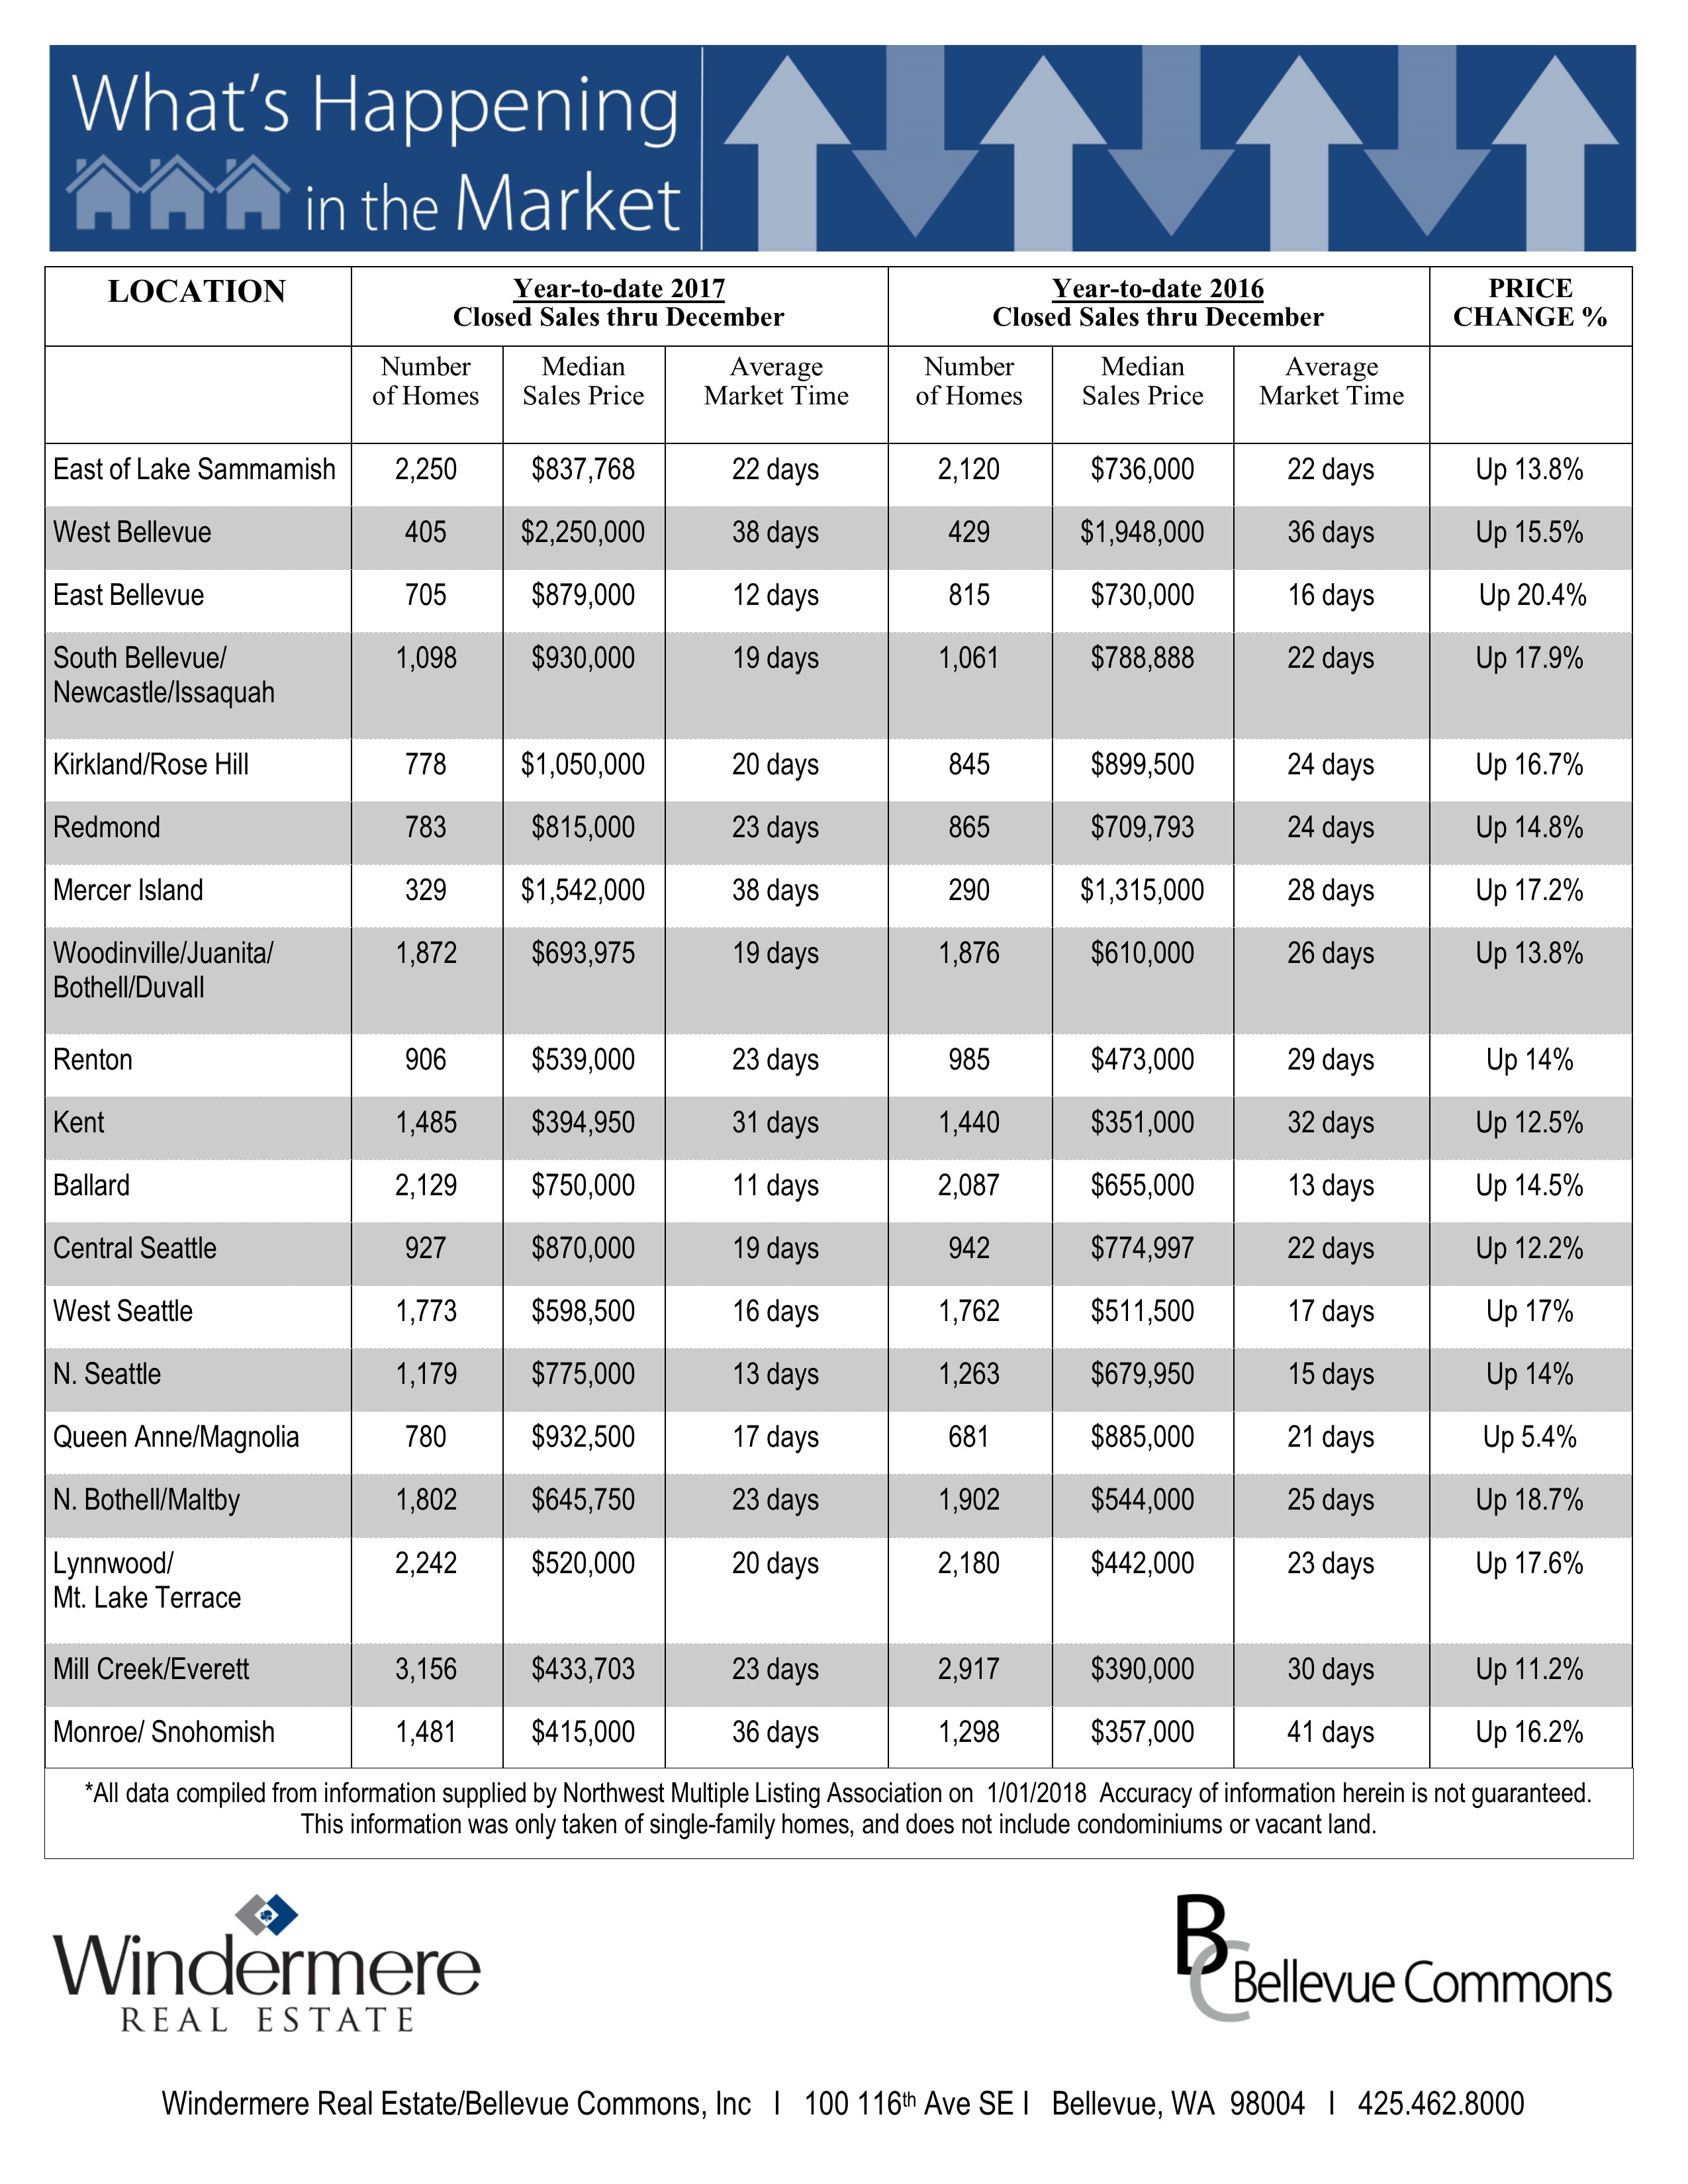
The year is over and 2017 has shown to be one of the best years in recent memory for equity gain while creating more and more competition due to dwindling availability of homes. Pricing has recently reached all time highs with the median prices doubling over the past 6 years. That being said we don’t see it changing anytime soon with Consumer and Builder confidence on an all-time high. Those looking to Sell in 2018 will need to position their homes in the best possible light to receive top dollar and Buyers will need to be truly prepared to Buy in order to be awarded a New home in 2018!
OTHER DECEMBER MONTHLY TALKING POINTS
Eastside (based on Residential and Condominium report):
. Home prices nearly double in six years going from $407,000 in December 2011 to $810,000 in December 2017.
. The number of homes sold in December is virtually unchanged from a year ago (538 vs 541) even though there are 22% fewer houses for sale (451 vs 530).
It feels like 2018 will be similar to the past few years. A total frenzy until summer and then a flattening in price for the second half of the year. Interesting consistency in the past three years:
1. Big jump in median closed price in December.
2. By April or May the closed Median Price has reached the level it will remain close to, until the big jump in December
The Washington State economy added 79,600 new jobs over the past 12 months—an impressive growth rate of 2.4%, and well above the national growth rate of 1.2%. However, as we anticipated in last quarter’s report, we continue to see a modest slowdown in the growth rate as the state grows closer to full employment. Growth has been broad-based, with expansion in all major job sectors other than Aerospace (a function of a slowdown at Boeing). Given the current rate of expansion, I am raising my employment forecast and now predict that Washington will add 81,000 new jobs in 2017.
Given the robust job market, it is unsurprising that the state unemployment rate continues to fall. The current unemployment rate in Washington State is 4.6% and we are essentially at full employment. Additionally, all counties contained within this report reported either a drop or stability in their unemployment rate from a year ago. I maintain my belief that the Washington State economy will continue to outperform the U.S. as a whole. Given such a strong expansion, we should also expect solid income growth across Western Washington.
HOME SALES ACTIVITY
There were 25,312 home sales during the third quarter of 2017. This is an increase of 3.6% over the same period in 2016.
Clallam County maintains its number one position for sales growth over the past 12 months. Only four other counties saw double-digit gains in sales. This demonstrates continuing issues with the low supply of listings. There were modest declines in sales activity in six counties.
The market remains remarkably tight with listing inventory down by 14.2% when compared to the third quarter of 2016. But inventory is up a significant 32% compared to the second quarter of this year. Pending sales rose by 5.2% over the same quarter a year ago, which suggests that closings in Q4 will still be robust.
The key takeaway from this data is that inventory is still very low, and the situation is unlikely to improve through the balance of the year.
HOME PRICES
Given tight supply levels, it is unsurprising to see very solid price growth across the Western Washington counties. Year-over-year, average prices rose 12.3% to $474,184. This is 0.9% higher than seen in the second quarter of this year.
With demand far exceeding supply, price growth in Western Washington continues to trend well above the longterm average. As I do not expect to see the new home market expand at any significant pace, there will be continued pressure on the resale market, which will cause home prices to continue to rise at above-average rates.
When compared to the same period a year ago, price growth was most pronounced in Grays Harbor County where sale prices were 20.1% higher than the third quarter of 2016. Nine additional counties experienced double-digit price growth.
Mortgage rates in the quarter continue to test the lows of 2017, and this is unlikely to change in the near-term. This will allow home prices to escalate further but I expect we will see rates start to rise fairly modestly in 2018, which could slow price growth.
DAYS ON MARKET
The average number of days it took to sell a home in the quarter dropped by eight days when compared to the same quarter of 2016.
King County continues to be the tightest market, with homes taking an average of 17 days to sell. Every county except San Juan saw the days on market drop from the same period a year ago.
This quarter, it took an average of 43 days to sell a home. This is down from the 51 days it took in the second quarter of 2016 and down by 8 days from the second quarter of this year.
At some point, inventory will start to grow and this will lead to an increase in the average time it takes to sell a house. However, I do not expect that to happen at any time soon. So we remain in a seller’s market.
CONCLUSIONS
This speedometer reflects the state of the region’s housing market using housing inventory, price gains, home sales, interest rates, and larger economic factors. For the third quarter of 2017, I have left the needle at the same point as the second quarter. Though price growth remains robust, sales activity has slowed very slightly and listings jumped relative to the second quarter. That said, the market is very strong and buyers will continue to find significant competition for accurately priced and well-located homes.
ABOUT MATTHEW GARDNER
Matthew Gardner is the Chief Economist for Windermere Real Estate, specializing in residential market analysis, commercial/industrial market analysis, financial analysis, and land use and regional economics. He is the former Principal of Gardner Economics, and has more than 30 years of professional experience both in the U.S. and U.K.

 Facebook
 X
X
 Pinterest
 Copy Link


 Given tight supply levels, it is unsurprising to see very solid price growth across the Western Washington counties. Year-over-year, average prices rose 12.3% to $474,184. This is 0.9% higher than seen in the second quarter of this year.

 This speedometer reflects the state of the region’s housing market using housing inventory, price gains, home sales, interest rates, and larger economic factors. For the third quarter of 2017, I have left the needle at the same point as the second quarter. Though price growth remains robust, sales activity has slowed very slightly and listings jumped relative to the second quarter. That said, the market is very strong and buyers will continue to find significant competition for accurately priced and well-located homes.
 Matthew Gardner is the Chief Economist for Windermere Real Estate, specializing in residential market analysis, commercial/industrial market analysis, financial analysis, and land use and regional economics. He is the former Principal of Gardner Economics, and has more than 30 years of professional experience both in the U.S. and U.K.