
 Facebook
 Twitter
 Pinterest
 Copy Link
Home Buying • Real Estate News • seattle • windermere • Windermere Bellevue Commons News •
October 1, 2019
Local Market Update September 2019

A decrease in inventory coupled with an increase in sales activity led to fewer options for home shoppers in August. There is some good news for would-be buyers as mortgage rates have dropped to their lowest level in three years. Demand remains high but there simply aren’t enough homes on the market. Brokers are hoping to see the traditional seasonal influx of new inventory as we move forward.
EASTSIDE
The median price of a single-family home on the Eastside was $935,000 in August, unchanged from a year ago and up slightly from $925,000 in July. New commercial and residential construction projects are in the works. Strong demand for downtown condos has prompted plans for yet another high-rise tower to break ground next year.

KING COUNTY
Home prices in King County were flat in August. The median price of a single-family home was $670,000, virtually unchanged from a year ago, and down just one percent from July. Southeast King County, which has some of the most reasonable housing values in the area, saw prices increase 9% over last year. Inventory remains very low. Year-over-year statistics show the volume of new listings dropped 18.5% in King County.

SEATTLE
Homes sales were up 12% in Seattle for August, putting additional pressure on already slim inventory. There is just over six weeks of available supply. There are signs that prices here are stabilizing as the median home price of $760,000 was unchanged from a year ago and up less than one percent from July. With its booming economy, demand here is expected to stay strong.

SNOHOMISH COUNTY
Buyers looking for more affordable options outside of King County pushed pending sales, mutually accepted offers, up nearly 16% over a year ago. Home prices have softened slightly. The median price of a single-family home in August was $490,000, down slightly from the median of $492,225 the same time last year.

VIEW FULL SNOHOMISH COUNTY REPORT
This post originally appeared on GetTheWReport.com
Market Stats • Real Estate News • windermere • Windermere Bellevue Commons News • Windermere Bellevue Commons News | Tagged homeless •
September 4, 2019
The Slow Down in Foreign Buyers
Originally published on the Windermere Blog.
Home Buying • Market Stats • Real Estate News • seattle • Windermere Bellevue Commons News • Windermere Bellevue Commons News | Tagged homeless •
July 31, 2019
Gardner Report Q2 2019


The following analysis of the Western Washington real estate market is provided by Windermere Real Estate Chief Economist Matthew Gardner. We hope that this information may assist you with making better-informed real estate decisions. For further information about the housing market in your area, please don’t hesitate to contact your Windermere agent.
Economic Overview
Washington State employment jumped back up to an annual growth rate of 2.4% following a disappointing slowdown earlier in the spring. As stated in the first quarter Gardner Report, the dismal numbers earlier this year were a function of the state re-benchmarking its data (which they do annually).
The state unemployment rate was 4.7%, marginally up from 4.5% a year ago. My current economic forecast suggests that statewide job growth in 2019 will rise by 2.6%, with a total of 87,500 new jobs created.
Home Sales Activity
- There were 22,281 home sales during the second quarter of 2019, representing a drop of 4.8% from the same period in 2018. On a more positive note, sales jumped 67.6% compared to the first quarter of this year.
- Since the middle of last year, there has been a rapid rise in the number of homes for sale, which is likely the reason sales have slowed. More choice means buyers can be more selective and take their time when choosing a home to buy.
- Compared to the second quarter of 2018, there were fewer sales in all counties except Whatcom and Lewis. The greatest declines were in Clallam, San Juan, and Jefferson counties.
- Listings rose 19% compared to the second quarter of 2018, but there are still a number of very tight markets where inventory levels are lower than a year ago. Generally, these are the smaller — and more affordable — markets, which suggests that affordability remains an issue.

Home Prices
-

Year-over-year price growth in Western Washington continues to taper. The average home price during second quarter was $540,781, which is 2.8% higher than a year ago. When compared to first quarter of this year, prices were up 12%.
- Home prices were higher in every county except King, which is unsurprising given the cost of homes in that area. Even though King County is home to the majority of jobs in the region, housing is out of reach for many and I anticipate that this will continue to act as a drag on price growth.
- When compared to the same period a year ago, price growth was strongest in Lewis County, where home prices were up 15.9%. Double-digit price increases were also seen in Mason, Cowlitz, Grays Harbor, and Skagit counties.
- The region’s economy remains robust, which should be a positive influence on price growth. That said, affordability issues are pervasive and will act as a headwind through the balance of the year, especially in those markets that are close to job centers. This will likely force some buyers to look further afield when searching for a new home.

Days on Market
- The average number of days it took to sell a home matched the second quarter of 2018.
- Snohomish County was the tightest market in Western Washington, with homes taking an average of only 21 days to sell. There were five counties where the length of time it took to sell a home dropped compared to the same period a year ago. Market time rose in eight counties and two were unchanged.
- Across the entire region, it took an average of 41 days to sell a home in the second quarter of 2019. This was the same as a year ago but is down 20 days compared to the first quarter of 2019.
- As stated above, days-on-market dropped as we moved through the spring, but all markets are not equal. I suggest that this is not too much of an issue and that well-priced homes will continue to attract attention and sell fairly rapidly.

Conclusions

This speedometer reflects the state of the region’s real estate market using housing inventory, price gains, home sales, interest rates, and larger economic factors. I am leaving the needle in the same position as the first quarter as demand appears to still be strong. The market has benefited from a fairly significant drop in mortgage rates. With average 30-year fixed rates still below 4%, I expect buyers who have been sitting on the fence will become more active, especially given that they have more homes to choose from.

As Chief Economist for Windermere Real Estate, Matthew Gardner is responsible for analyzing and interpreting economic data and its impact on the real estate market on both a local and national level. Matthew has over 30 years of professional experience both in the U.S. and U.K.
In addition to his day-to-day responsibilities, Matthew sits on the Washington State Governors Council of Economic Advisors; chairs the Board of Trustees at the Washington Center for Real Estate Research at the University of Washington; and is an Advisory Board Member at the Runstad Center for Real Estate Studies at the University of Washington where he also lectures in real estate economics.
This post originally appeared on the Windermere.com Blog.
First posted on windermere-bellevue.com
Real Estate Tips • Windermere Bellevue Commons News •
July 3, 2019
Are You Better Off Paying Your Mortgage Early or Investing Your Money?


Photo Credit: Rawpixel via Unsplash
Few topics cause more division among economists than the age-old debate of whether you’re better off paying off your mortgage earlier, or investing that money instead. And there’s a good reason why that debate continues; both sides make compelling arguments.
For many people, their mortgage is the largest expense they will ever incur in their lives. So if given the chance, it only makes logical sense you would want to pay it off as quickly as possible. On the other hand, a mortgage is also the cheapest money you will ever borrow, and it’s generally considered good debt. Any extra money you obtain could be definitely be put to good use elsewhere.
The reality is, however, a little less cut and clear. For some homeowners, paying off their mortgage earlier is the right answer. While for others, it would be far more advantageous to invest their money.
Advantages of paying off your mortgage earlier
- You’ll pay less interest: Each time you make a mortgage payment, a portion is dedicated towards interest, and another towards principal (we’ll ignore other costs for now). Interest is calculated monthly by taking your remaining balance, the length of your amortization period, and the interest rate agreed upon with your lending institution.
If you have a $300,000 mortgage, at a 4% fixed rate over 30 years, your monthly payment would be around $1,432.25. By the time you finish paying off your mortgage, you would have paid a total of $515,609, of which $215,609 were interest.
If you wanted to lower the total amount you pay on interest, you don’t need to make a large lump sum to make a difference. If you were to increase your monthly mortgage payment to $1,632.25 (a $200 a month increase), you would be saving $50,298 in interest, and you’ll pay off your mortgage 6 years and 3 months earlier.
Though this is an oversimplified example, it shows how even a small increase in monthly payments makes a big difference in the long run.
- Every additional dollar towards your principal has a guaranteed return on investment: Every additional payment you make towards your mortgage has a direct effect in lowering the amount you pay in interest. In fact, each additional payment is, in fact, an investment. And unlike stocks, bonds, and other investment vehicles, you are guaranteed to have a return on your investment.
- Enforced discipline: It takes real commitment to invest your money wisely each month instead of spending it elsewhere.
Your monthly mortgage payments are a form of enforced discipline since you know you can’t afford to miss them. It’s far easier to set a higher monthly payment towards your mortgage and stick to it than making regular investments on your own.
Besides, once your home is completely paid off, you can dedicate a larger portion of your income towards investments, your children or grandchildren’s education, or simply cut down on your working hours.
Advantages of investing your money
- A greater return on your investment: The biggest reason why you should invest your money instead comes down to a simple, green truth: there’s more money to be made in investments.
Suppose that instead of dedicating an additional $200 towards your monthly mortgage payment, you decide to invest it in a conservative index fund which tracks S&P 500’s index. You start your investment today with $200 and add an additional $200 each month for the next 30 years. By the end of the term, if the index fund had a modest yield of 5% per year, you will have earned $91,739 in interest, and the total value of your investment would be $163,939.
If you think that 5% per year is a little too optimistic, all we have to do is see the S&P 500 performance between December 2002 and December 2012, which averaged an annual yield of 7.10%.
- A greater level of diversification: Real estate has historically been one of the safest vehicles of investment available, but it’s still subject to market forces and changes in government policies. The forces that affect the stock and bonds markets are not always the same that affect real estate, because the former are subject to their issuer’s economic performance, while property values could change due to local events.
By putting your extra money towards investments, you are diversifying your investment portfolio and spreading out your risk. If you are relying exclusively on the value of your home, you are in essence putting all your eggs in one basket.
- Greater liquidity: Homes are a great investment, but it takes time to sell a home even in the best of circumstances. So if you need emergency funds now, it’s a lot easier to sell stocks and bonds than a home.
First posted on windermere-bellevue.com.
Fanatical News • Home Buying • Market Stats • Real Estate News • Real Estate Tips • seattle • windermere • Windermere Bellevue Commons News •
October 31, 2018
Western Washington Real Estate Market Update


The following analysis of the Western Washington real estate market is provided by Windermere Real Estate Chief Economist Matthew Gardner. We hope that this information may assist you with making better-informed real estate decisions. For further information about the housing market in your area, please don’t hesitate to contact your Windermere Agent.
Economic Overview
Washington State continues to be one of the fastest growing states in the nation and there is little to suggest that there will be any marked slowdown in the foreseeable future. Over the past year, the state has added 105,900 new jobs, representing an annual growth rate of 3.2%. This remains well above the national rate of 1.65%. Private sector employment gains continue to be robust, increasing at an annual rate of 3.7%. The strongest growth sectors were Construction (+7.4%), Information (+6.2%), and Professional & Business Services (+6.1%). The state’s unemployment rate was 4.5%, down from 4.8% a year ago.
All year I’ve been predicting that Washington State’s annual job growth would outperform the nation as a whole, and we now know with certainty that this is going to be the case. Furthermore, I am now able to predict that statewide job growth in 2019 will be equally strong, with an expected increase of 2.6%.
Home Sales Activity
-
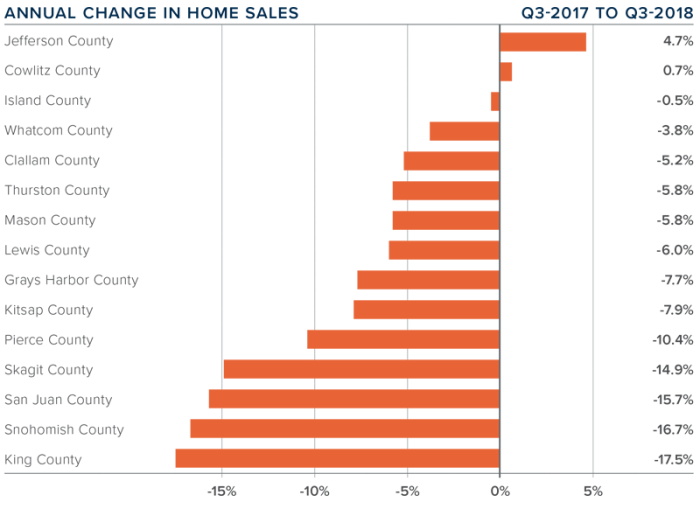
There were 22,310 home sales during the third quarter of 2018. This is a significant drop of 12.7% compared to the third quarter of 2017.
-
The number of homes for sale last quarter was up 14.5% compared to the third quarter of 2017, continuing a trend that started earlier in the year. However, the increase in listings was only in Seattle’s tri-county area (King, Pierce, and Snohomish Counties) while listing activity was down across the balance of the region.
-
Only two counties had a year-over-year increase in home sales, while the rest of Western Washington saw sales decrease.
-
The region has reached an inflection point. With the increase in the number of homes for sale, buyers now have more choices and time to make a decision about what home to buy.
Home Prices
-
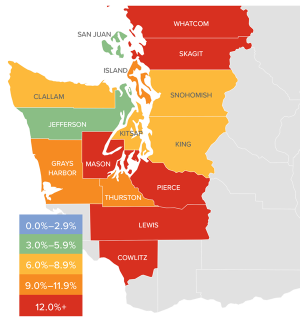 As inventory levels start to rise, some of the heat has been taken off the market, which caused home prices in the Western Washington region to go up by a relatively modest 6.2% over last year to $503,039. Notably, prices are down by 4.4% when compared to the second quarter of this year.
 -
Home prices, although higher than a year ago, continue to slow due to the significant increase in the number of homes for sale. This, in my opinion, is a very good thing.
-
When compared to the same period a year ago, price growth was strongest in Lewis County, where home prices were up 15.3%. Six other counties experienced double-digit price increases.
-
Slowing price growth was inevitable; we simply could not sustain the increases we’ve experienced in recent years. Lower rates of appreciation will continue until wage growth catches up.

Days on Market
-
The average number of days it took to sell a home dropped by four days compared to the same quarter of 2017.
- Across the entire region, it took an average of 39 days to sell a home in the third quarter of this year. This is down from 43 days in the third quarter of 2017 and down 2 days when compared to the second quarter of 2018.
-
King County continues to be the tightest market in Western Washington, with homes taking an average of only 19 days to sell. Every county in the region other than Skagit and King — which both saw the time on the market rise by 2 days — saw the length of time it took to sell a home drop when compared to the same period a year ago.
-
More choice in the market would normally suggest that the length of time it takes to sell a home should rise, but the data has yet to show that. That said, compared to last quarter, we are seeing some marked increases in days on market in several counties, which will be reflected in future reports.

Conclusions

This speedometer reflects the state of the region’s real estate market using housing inventory, price gains, home sales, interest rates, and larger economic factors. I started to move the needle toward buyers last quarter and have moved it even further this quarter. Price growth continues to slow, but more significant is the rise in listings, which I expect to continue as we move toward the quieter winter period.
I believe that psychology will start to play a part in the housing market going forward. It has been more than 15 years since we’ve experienced a “balanced” market, so many home buyers and sellers have a hard time remembering what one looks like. Concerns over price drops are overrated and the length of time it’s taking to sell a home is simply trending back to where it used to be in the early 2000s.

Matthew Gardner is the Chief Economist for Windermere Real Estate, specializing in residential market analysis, commercial/industrial market analysis, financial analysis, and land use and regional economics. He is the former Principal of Gardner Economics, and has more than 30 years of professional experience both in the U.S. and U.K.
This post originally appeared on the Windermere.com Blog.
First posted on windermere-bellevue.com.
Market Stats • Real Estate News • seattle •
July 26, 2018
How Facebook and Microsoft multi-million expansion projects are going to change Redmond?
Two IT giants are planning to expand their campuses in Redmond at the same time.
Facebook has spent $106 million on construction and development permits for Oculus offices in Redmond over the last three years. And in 2018 alone, Facebook spent $88.3 million on Oculus -related permits for as many as eight new offices in the area. BuildZoom’s analysis identifies five properties, in particular, all on Willow Road in Redmond, that span more than 90,000 square feet of lab and office space. Those locations are 10545 Willows Rd., 10785 Willows Rd., 9805 Willows Rd., 9845 Willows Rd. and 9461 Willow Road.
Microsoft will construct 18 new buildings on the campus over the next five to seven years, which currently has 80. It will renovate several other buildings to give them a modern, open feel.
Home Update • Market Stats • Real Estate News • windermere • Windermere Bellevue Commons News | Tagged homeless •
July 25, 2018
The Gardner Report – Second Quarter 2018


The following analysis of the Western Washington real estate market is provided by Windermere Real Estate Chief Economist Matthew Gardner. We hope that this information may assist you with making better-informed real estate decisions.
Economic Overview
The Washington State economy added 83,900 new jobs over the past 12 months, representing an annual growth rate of 2.5%. This is a slowdown from the last quarter, but employment growth remains well above the national rate of 1.6%. Employment gains continue to be robust in the private sector, which was up by 2.8%. The public sector (government) grew by a more modest 1.1%.
The strongest growth sectors were Retail Trade and Construction, which both rose by 4.8%. Significant growth was also seen in the Education & Health Services and Information sectors, which rose by 3.9% and 3.4%, respectively.
The State’s unemployment rate was 4.7%, down from 4.8% a year ago. Washington State will continue adding jobs for the balance of the year and I anticipate total job growth for 2018 will be around 80,000, representing a total employment growth rate of 2.4%.
Home Sales Activity
-
There were 23,209 home sales during the second quarter of 2018. This is a drop of 2.3% compared to the same period a year ago.
-
Clallam County saw sales rise the fastest relative to the same period a year ago, with an increase of 12.6%. Jefferson County also saw significant gains in sales at 11.1%.
-
The number of homes for sale last quarter was down by a nominal 0.3% when compared to the second quarter of 2017, but up by 66% when compared to the first quarter of this year. Much has been mentioned regarding the growth in listings, but it was not region-wide. King County saw a massive 31.7% increase in inventory, though all but three of the other counties covered in this report saw the number of listings drop compared to a year ago.
-
The takeaway from this data is that while some counties are seeing growth in listings — which will translate into sales down the road — the market is still out of balance.

Home Prices
-
 As inventory is still fairly scarce, growth in home prices continues to trend well above the long-term average. Prices in Western Washington rose 12.2% over last year to $526,398.
 -
Home prices continue to trend higher across Western Washington, but the pace of growth has started to slow. This should please would-be buyers. The spring market came late but inventory growth in the expensive King County market will give buyers more choices and likely lead to a slowing down of price growth as bidding wars continue to taper.
-
When compared to the same period a year ago, price growth was strongest in Mason County, which was up 17.4%. Eleven other counties experienced double-digit price growth.
-
Mortgage rates, which had been rising significantly since the start of the year, have levelled off over the past month. I believe rising rates are likely the reason that inventory levels are rising, as would-be sellers believe that this could be the right time to cash out. That said, the slowing in rate increases has led buyers to believe that rates will not jump soon, which gives them a little more breathing room. I do not expect to see any possible slowdown in demand until mortgage rates breach the 5% mark.
Days on Market
-
The average number of days it took to sell a home dropped by seven days compared to the same quarter of 2017.
-
King County continues to be the tightest market in Western Washington, with homes taking an average of only 13 days to sell. Every county in the region other than Clallam saw the length of time it took to sell a home drop when compared to the same period a year ago.
-
Across the entire region, it took an average of 41 days to sell a home in the second quarter of this year. This is down from 48 days in the second quarter of 2017 and down by 20 days when compared to the first quarter of 2018.
-
Although we did see some inventory increases when compared to the first quarter of the year, we are essentially at the same level of homes on the market as a year ago. The market has yet to reach equilibrium and I certainly do not expect to reach that point until sometime in 2019.

Conclusions

This speedometer reflects the state of the region’s real estate market using housing inventory, price gains, home sales, interest rates, and larger economic factors. For the second quarter of 2018, I have moved the needle very slightly towards buyers, but it remains firmly a seller’s market. This shift is a function of price growth tapering very slightly, as well as the expectation that we should see more homes come on the market as we move through the balance of the year.
Matthew Gardner is the Chief Economist for Windermere Real Estate, specializing in residential market analysis, commercial/industrial market analysis, financial analysis, and land use and regional economics. He is the former Principal of Gardner Economics, and has more than 30 years of professional experience both in the U.S. and U.K.
This post originally appeared on the Windermere.com Blog.
Market Stats • Real Estate News • seattle •
June 13, 2018
What’s Happening in the Market in May 2018?
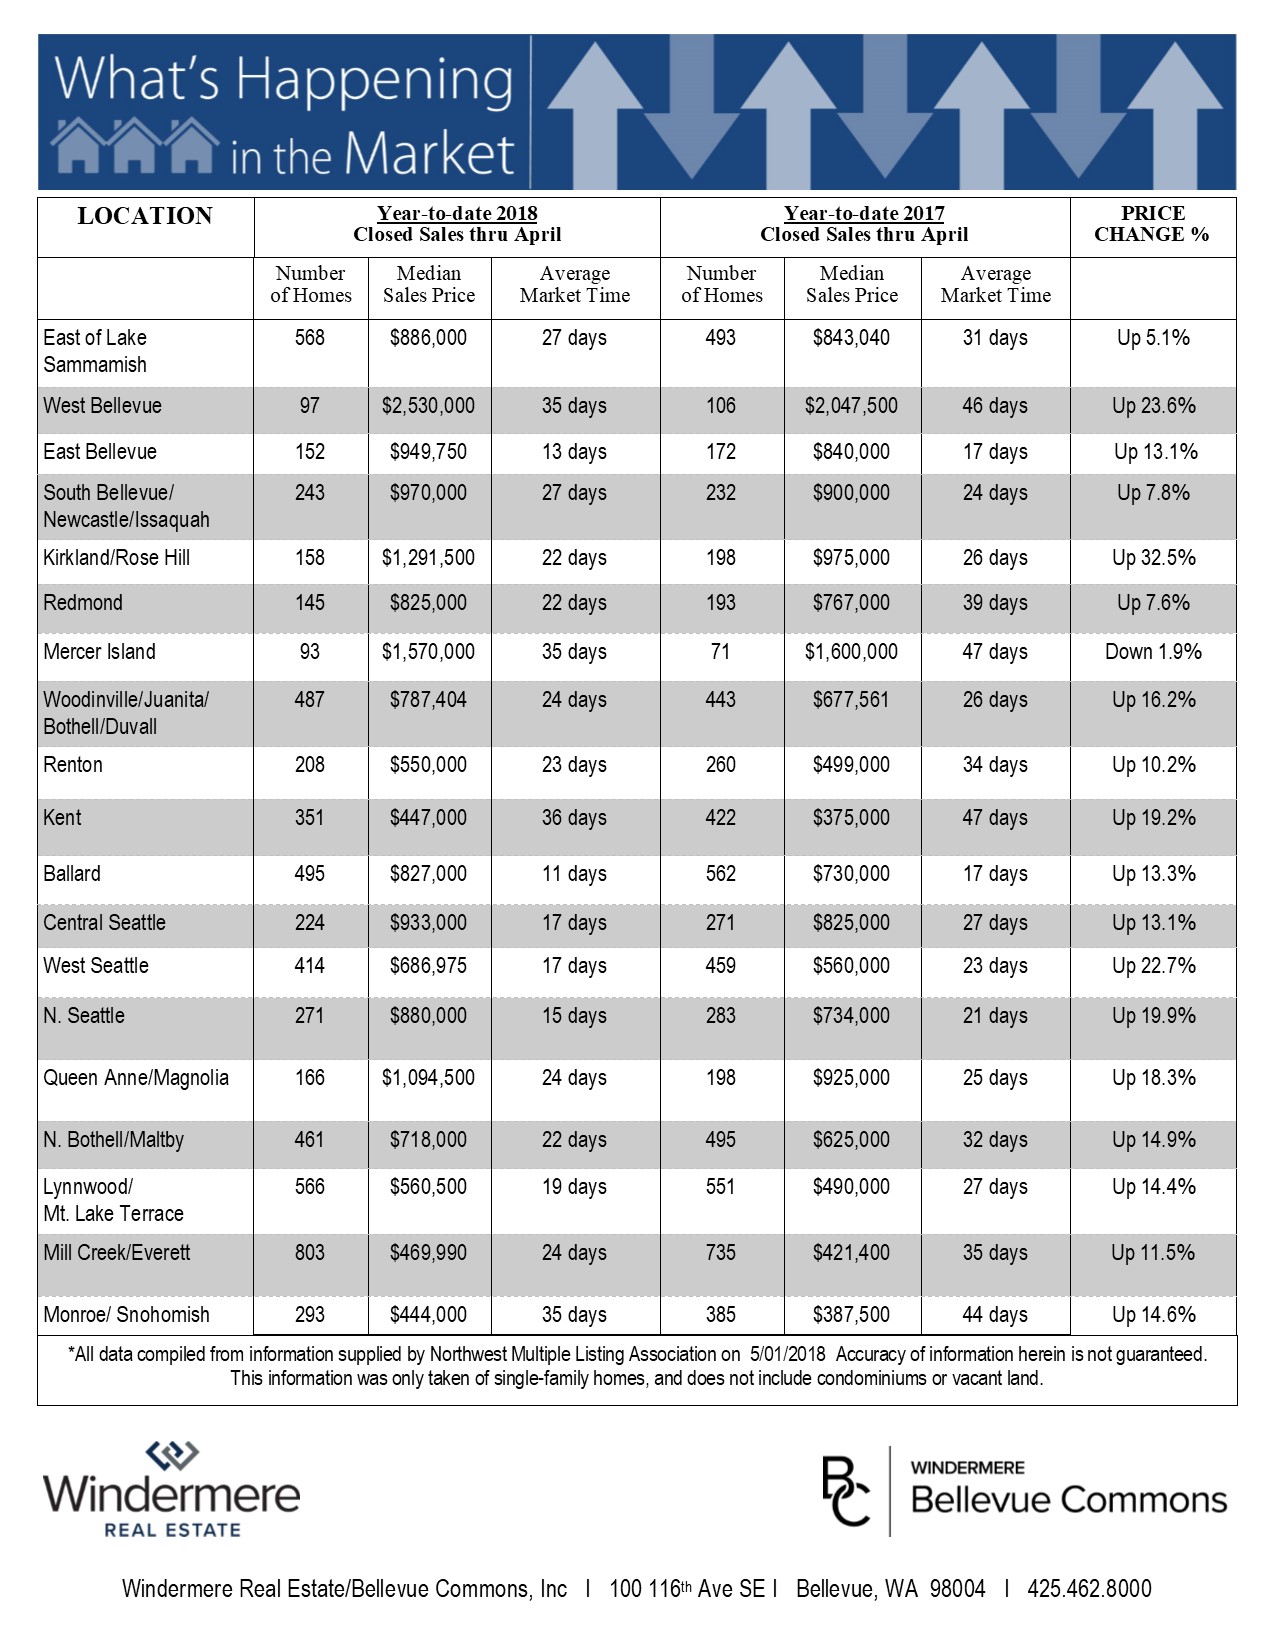
Here are the Current stats via “What’s Happening in the Market” for the month of May 2018 for Eastside (based on Residential and Condominium report):
- Is the market shifting? It is too early to call and the real estate statistics show demand still far exceeding supply, however still low, there has been a significant increase in inventory.
- Number of properties for sale is increasing:
o 1,230 active properties for sale is the highest number in the past 20 months or since August 2016.
o Active inventory is up 350 properties or 40% compared to a year ago (May 2018 = 1,230 vs May 2017 = 880)
- Statistics indicating more demand than supply:
o Less than one month’s supply of inventory.
0.9 May 2018 vs 0.6 May 2017 vs 0.8 May 2016 vs 1.1 May 2015
o Sales prices on closed May sales are up 14% to $859,950 vs $753,750 May 2017.
o 58% of houses sold over list price compared to 62% in April 2018 and 61% in May 2017
The increased inventory means Sellers and listing brokers will need to consider active competition. Condition, marketing and pricing will be more important with rising inventory.

